
MHH-PREB-1
Cat.No.: CSC-C0407
Species: Homo sapiens (Human)
Source: Lymph Node
Morphology: round cells growing singly or in clusters in suspension
Culture Properties: suspension
- Specification
- Background
- Scientific Data
- Q & A
- Customer Review
Immunology: CD3 -, CD10 +, CD13 -, CD19 +, CD20 +, CD34 -, CD37 +, CD38 +, cyCD79a +, CD80 -, CD138 -, sm/c
MHH-PREB-1 is a human precursor B-cell leukemia cell line derived from a patient with precursor B-cell acute lymphoblastic leukemia (pre-B ALL). This cell line provides a useful in vitro model for the study of molecular mechanisms of B-cell development, leukemogenesis and therapeutic response in hematologic malignancies. The MHH-PREB-1 cells display immunophenotypic features of precursor B lymphocytes, including expression of early B-cell markers associated with immature lymphoid differentiation. MHH-PREB-1 cells are widely used in leukemia research because of their stable growth properties and reproducible biological behavior, especially in studies on signal transduction, regulation of apoptosis, drug resistance, and activation of oncogenic pathways. The cell line has also been used to study chromosomal aberrations and gene expression profiles in the progression of acute lymphoblastic leukemia.
Furthermore, MHH-PREB-1 offers a valuable platform for testing novel anticancer agents, targeted therapeutics, and immunomodulatory approaches. The model is also often used by researchers studying cytokine signaling, chemotherapy sensitivity, and interactions between leukemic cells and the microenvironment. MHH-PREB-1 remains a well-characterized pre-B ALL model that contributes to both basic leukemia biology and translational hematology research, thereby supporting the improvement of therapeutic strategies for pediatric and adult ALL.
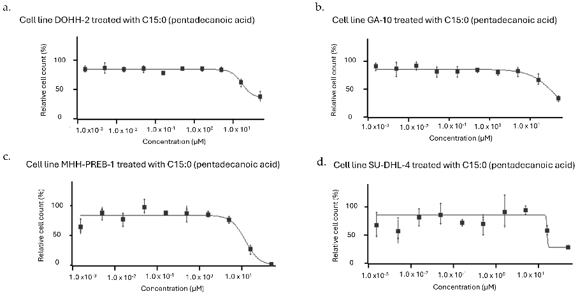
C15:0 Had Selective Inhibitory Activities Against Specific Human Cancer Cell Types, Especially B-Cell Lymphomas
Pentadecanoic acid (C15:0), a saturated fatty acid, displays anticancer action at high doses, although its physiological effects are still unknown. Venn-Watson et al. tested C15:0 at concentrations ranging from 1.5 nM to 50 µM on 94 human cancer cell lines. Data from the Hs 229.T cell line were omitted since this line was classed as a fibroblast line.
C15:0 inhibited 13 (13.8%) cell lines with EC50 ≤ 50 µM (6-47 µM). Most susceptible lines were non-Hodgkin B-cell lymphomas (n=8; 61.5%) with fewer hepatocellular (n=2), breast (n=2) and lung (n=1) cancer lines impacted. The lymphoma cell lines DOHH-2, GA-10, MHH-PREB-1 and SU-DHL-4 demonstrated EC50, IC50 and GI50 values ≤ 50 µM (Figure 1). In contrast, majority of the lung (25/26), breast (15/17), pancreatic (13/13) and liver (5/7) cancer cell lines were resistant (EC50 > 50 µM). With 81 (86.2%) cell lines resistant to the drug.
Ask a Question
Write your own review
- You May Also Need

Description: Established in 2007 from the bone marrow mononuclear cells of an 82-year-old Japanese man with diffuse large B-cell lymphoma in the leukemic phase
Description: Established from the bone marrow of a 28-year-old man who developed the terminal leukemic phase of lymphosarcoma in 1976
Description: This cell line was derived from the bone marrow aspirate of a 59 year old male with erythroleukemia that became acute myelogenous leukaemia.The cells form colonies in soft-agar in the presence of ...

Description: Established from the pleural effusion of a 24-year-old woman with recurrent anaplastic large cell lymphoma (ALCL); cells were described to clonally derive from T-lineage lymphoid cells and to be ...

Description: Established from a 37-year-old man at second (refractory/terminal) relapse of Hodgkin lymphoma (nodular sclerosing -> lymphocyte depleted/stage IIISA -> stage IV) after both combined chemo- and ...
Description: Established from the peripheral blood of a 10-year-old Caucasian boy with acute lymphoblastic leukemia (pre B-ALL) at diagnosis in 1993
- Adipose Tissue-Derived Stem Cells
- Human Neurons
- Mouse Probe
- Whole Chromosome Painting Probes
- Hepatic Cells
- Renal Cells
- In Vitro ADME Kits
- Tissue Microarray
- Tissue Blocks
- Tissue Sections
- FFPE Cell Pellet
- Probe
- Centromere Probes
- Telomere Probes
- Satellite Enumeration Probes
- Subtelomere Specific Probes
- Bacterial Probes
- ISH/FISH Probes
- Exosome Isolation Kit
- Human Adult Stem Cells
- Mouse Stem Cells
- iPSCs
- Mouse Embryonic Stem Cells
- iPSC Differentiation Kits
- Mesenchymal Stem Cells
- Immortalized Human Cells
- Immortalized Murine Cells
- Cell Immortalization Kit
- Adipose Cells
- Cardiac Cells
- Dermal Cells
- Epidermal Cells
- Peripheral Blood Mononuclear Cells
- Umbilical Cord Cells
- Monkey Primary Cells
- Mouse Primary Cells
- Breast Tumor Cells
- Colorectal Tumor Cells
- Esophageal Tumor Cells
- Lung Tumor Cells
- Leukemia/Lymphoma/Myeloma Cells
- Ovarian Tumor Cells
- Pancreatic Tumor Cells
- Mouse Tumor Cells