Collagen-Induced Arthritis (CIA) Models
Collagen-induced arthritis (CIA) is an animal model simulating the human autoimmune disease rheumatoid arthritis (RA) and it is induced in animals by immunization with type II collagen (CII). CIA symptoms is composed of an erosive cartilage and bone inflammation induced by an autoimmune attack, mediated by both T and B lymphocytes. Creative Bioarray specializes in providing customized pharmacodynamic research services to help customers assess the efficacy of drug candidates and study the associated pathological mechanisms of arthritis through CIA models.
Collagen-induced arthritis (CIA) models include but not limited to:
- Collagen-Induced Arthritis (CIA) in Rats
- Collagen-Induced Arthritis (CIA) in Mice
Our capabilities
- We use Collagen-induced arthritis (CIA) models to test the efficacy of drugs targeting RA.
- We assess the severity of rheumatoid arthritis in animals by Clinical scoring system.
- We evaluate various biomarkers and cytokines through WB, IHC, ELISA, etc.
Assays available
- Clinical score
- Histopathology
- Biomarker analysis
- Cytokine analysis
- PK/PD blood analysis
- Paw volume
- Ankle thickness
With extensive experience in the field of CIA, we are confident to help you to overcome any upcoming challenges. Our experts are fully capable of customizing our protocols and assays to meet your specific needs. With our help, we wish to facilitate your research with high efficiency.
Study examples
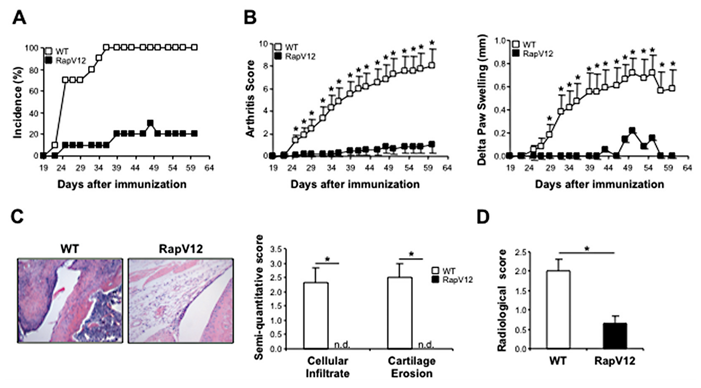 Figure. 1. Effects of T cell Rap1 activation on the development of collagen-induced arthritis. Arthritis was induced in wild-type (WT) and RapV12-transgenic mice (n = 10 per group) by immunization with chicken type II collagen in Freund’s complete adjuvant on days 0 and 21. Hind paw swelling and inflammation of the 4 limbs were monitored for each mouse during the course of the disease. (A), Cumulative disease incidence scores in wild-type and RapV12-transgenic mice, calculated as the percentage of affected animals. (B), Clinical arthritis scores and paw swelling in wild-type and RapV12-transgenic mice during the course of disease. Values are the mean and SEM. P = P < 0.05 versus RapV12-transgenic mice. (C), Representative photomicrographs of paraffin-embedded sections of hind paws stained with hematoxylin and eosin and semiquantitative analyses of cellular infiltration and cartilage erosion scores for each mouse (original magnification × 200). (D), Semiquantitative analysis of scoring of radiographs for radiologic damage. Bars show the mean and SEM. P = P<0.05. n.d. = not detectable.
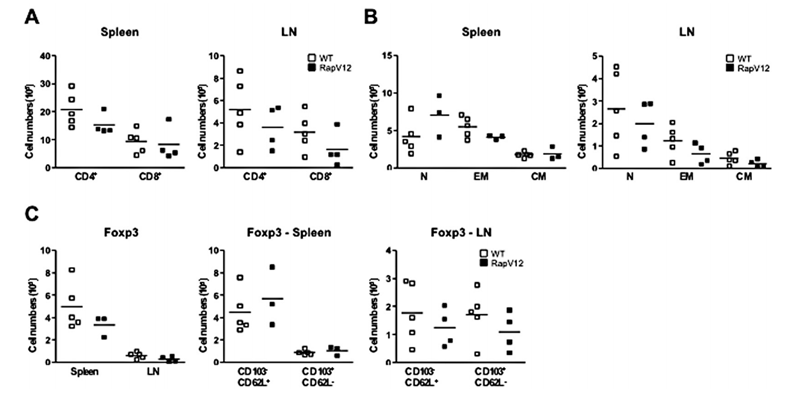 Figure 2. Phenotypic characterization of T cells in wild-type and RapV12-transgenic mice during the onset of arthritis. Spleens and LNs were collected from mice 42 days after primary immunization and analyzed by flow cytometry. (A and B), Absolute numbers of CD3+CD4+ and CD3+CD8+ T cell subsets (A) and absolute numbers of naive CD44-CD62L+, effector memory CD44+CD62L-, and central memory CD44+CD62L+ CD4+ T cells (B) present in the spleen and LNs of wild-type and RapV12-transgenic mice. (C), Absolute numbers of regulatory FoxP3+CD4+ T cells in the spleen and LNs (left panel), and FoxP3+CD103-CD62L+ and FoxP3+CD103+CD62L- CD4+ T cells in the spleen (middle panel) and LNs (right panel) of wild-type and RapV12-transgenic mice. Horizontal lines show the mean; boxes represent individual mice (n = 3–5 mice per group). See Figure 2 for definitions.
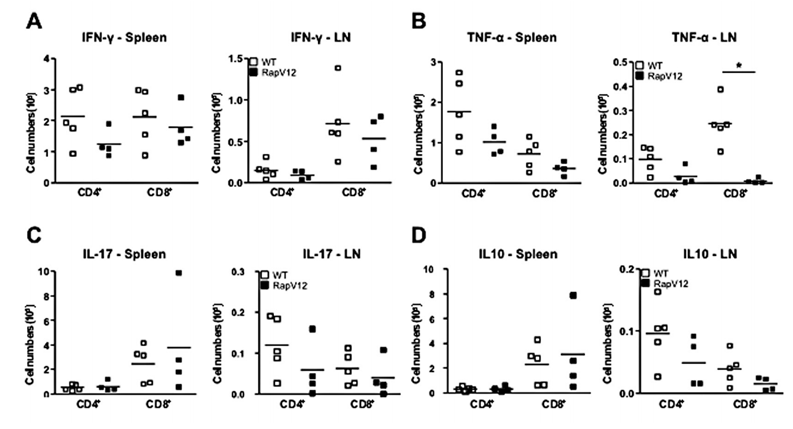 Figure. 3. Cytokine responses of T cells in wild-type and RapV12-transgenic mice during the onset of arthritis. Spleens and LNs of wild-type mice (n = 5) and RapV12-transgenic mice (n = 4) were collected 42 days after primary immunization, and intracellular cytokine production was assessed by flow cytometry. Intracellular expression of (A), IFNγ, (B), TNFα, (C), IL-17, and (D), IL-10 in CD3+CD4+ and CD3+CD8+ T cells following 5 hours of stimulation with phorbol myristate acetate/ionomycin is shown. Horizontal lines show the mean; boxes represent individual mice. P = P<0.002. See Figure 3 for definitions.
Quotation and ordering
If you have any special needs or questions regarding our services, please feel free to contact us. We look forward to cooperating with you in the future.
Reference
Abreu J R F et al. Sustained T cell Rap1 signaling is protective in the collagen-induced arthritis model of rheumatoid arthritis[J]. Arthritis Rheum, 2014, 62(11):3289-3299.