Experimental Autoimmune Encephalomyelitis (EAE) Models
Full-service in vivo EAE models for mechanistic studies, efficacy assessment and translation in MS. Our platform integrates multiple EAE model systems to help you select the most appropriate strategy based on your drug mechanism and research goals.

Overview of Multiple Sclerosis (MS)
Multiple sclerosis (MS) is a debilitating autoimmune disease of the central nervous system that affects approximately 2.8 million people worldwide and is increasing in prevalence across North America and Europe. The disease is mediated by autoreactive CD4⁺ T cells (Th1 and Th17) reactive to myelin antigens MOG, MBP, and PLP. These cells cross a compromised blood–brain barrier and trigger inflammatory cascades, releasing cytokines like IL-17, IFN-γ, and TNF-α, which amplify neuroinflammation and cause oligodendrocyte damage, demyelination, and axonal injury, ultimately leading to progressive neurological disability.
Current disease modifying therapies (e.g., fingolimod, ocrelizumab) can decrease relapse rates but fail to stop disease progression. Long-term use of immunosuppressants also increases the risk for infection. Additionally, there are no reliable strategies for promoting remyelination and neurorepair.
Experimental autoimmune encephalomyelitis (EAE) is the most widely used experimental model of MS. It robustly and reproducibly mimics important aspects of the disease including T cell–mediated neuroinflammation, blood–brain barrier breakdown, and demyelination, making it a valuable model for evaluating potential therapeutic interventions.
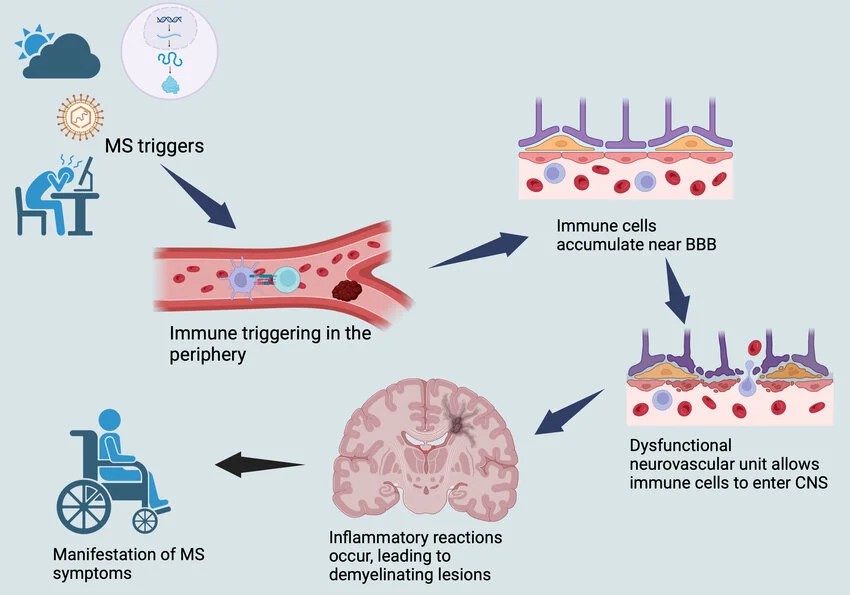 Fig. 1. Illustrates a brief overview of MS pathophysiology (Mohammed E M, 2024).
Explore Our EAE Models

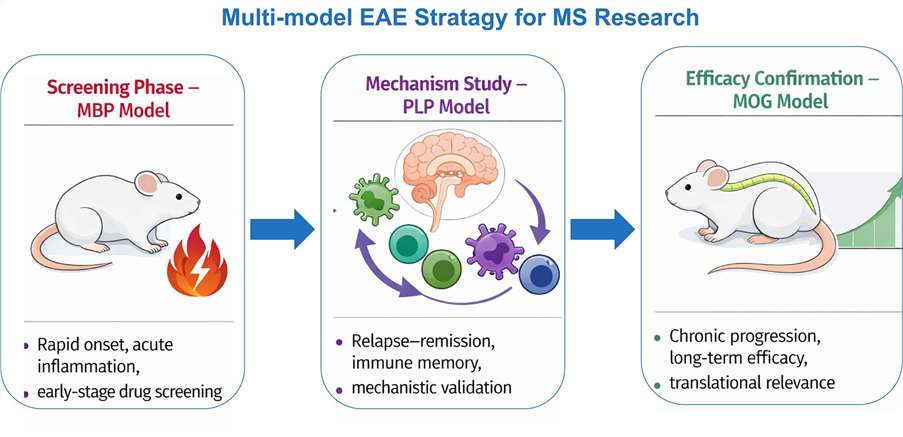
MOG-Induced EAE Model
- Chronic or chronic-relapsing EAE phenotype resembling progressive MS featuresTypically established in C57BL/6 mice
- Most widely used for efficacy evaluation and long-term studies

PLP-Induced EAE Model
- Relapsing–remitting disease course
- Strong immune memory component
- Ideal for studying MS relapse mechanisms

MBP-Induced EAE Model
- Acute and rapid-onset inflammation
- Classically established in Lewis rats
- High reproducibility for short-term studies
Comparison of EAE Models
| Feature | MOG | PLP | MBP |
| Disease Course | Chronic progressive | Relapsing–remitting | Acute monophasic |
| Common Species | C57BL/6 mouse | SJL mouse | Lewis rat (primarily) |
| Onset Speed | Moderate | Moderate | Rapid |
| Key Application | Disease progression studies | Relapse mechanism studies | Acute neuroinflammation studies |
| PTX Requirement | Required | Required | Not required |
| Translational Relevance | High | Medium–high | Moderate |
How to Choose the Right EAE Model
Choosing the right EAE model is essential for aligning preclinical outcomes with clinical expectations.
Comprehensive Support for EAE Studies
Creative Bioarray provides end-to-end support for preclinical MS research using EAE models, enabling precise evaluation of therapeutic candidates and mechanistic investigation. Our capabilities include:
1. Therapeutic Assessment
Evaluate candidate compounds targeting multiple sclerosis using MOG, PLP, and MBP EAE models.
2. Clinical Scoring
Monitor disease progression and severity with the standardized EAE clinical score system.
3.Histopathological Analysis
Quantify lymphocyte infiltration, demyelination, and axonal damage in CNS tissues using advanced staining and microscopy techniques.
Why Choose Us for EAE Studies

Extensive EAE Expertise
We have established multiple EAE models across different species and protocols, ensuring flexibility for diverse research needs.

Tailored Study Design
We match the right model with the appropriate endpoints to align with your drug mechanism and development goals.

High Reproducibility
Our standardized SOPs and experienced team ensure consistent and reliable results across studies.

Flexible Endpoint Options
From basic clinical scoring to advanced translational biomarkers, we support a wide range of study endpoints.
Start Your EAE Study Today
Accelerate your multiple sclerosis research with validated EAE models and tailored study design.
Reference
- Mohammed EMA. Understanding Multiple Sclerosis Pathophysiology and Current Disease-Modifying Therapies: A Review of Unaddressed Aspects. Front Biosci (Landmark Ed). 2024. 29(11):386.