Particle Size Analysis (TEM, SEM)
- Service Details
- Features
- FAQ
Particle size analysis functions as an essential method for assessing material performance and functionality across nanotechnology applications and in fields like drug delivery systems and biomaterials engineering. Transmission Electron Microscopy (TEM) and Scanning Electron Microscopy (SEM), recognized as the "gold standards" for particle size analysis, provide detailed insights into the internal structures and surface morphologies of nanoparticles. These techniques assist researchers in optimizing material design, validating process stability, and elucidating the composition of biomolecular complexes.
At Creative Bioarray, our Particle Size Analysis Service leverages state-of-the-art electron microscopy platforms and a multidisciplinary team to offer end-to-end solutions—from basic imaging to advanced data interpretation—empowering breakthroughs in research, process optimization, and product development.
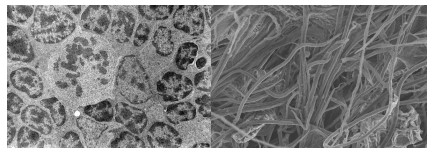
TEM micrograph of a mitotic cell surrounded by interphase cells (left) and Cellulose fiber from rice straw with a scanning electron microscope (right).
Creative Bioarray's Particle Size Analysis Services
Workflow
1
Requirement Consultation
Free technical consultation to define objectives (resolution, imaging modes).
2
Sample Preprocessing
Guided preparation protocols (e.g., sectioning, coating) or full-service lab processing.
3
Data Acquisition & Optimization
Multi-region, multi-parameter scanning with artifact correction and image enhancement.
4
Comprehensive Reporting
Delivery of raw data, high-resolution images, and expert analysis (size distribution histograms, elemental maps, etc.
Transmission electron microscopy (TEM) analysis
A high-energy electron beam penetrates ultrathin samples (<100 nm thickness), generating high-resolution images (up to 0.1 nm resolution) through diffraction and scattering signals. Ideal for characterizing nanoparticles, liposomes, viral particles, and protein aggregates.
- Compatible formats: Powders, liquid suspensions.
- Solid samples: Thin sections prepared via ion milling, double-jet polishing, FIB, or ultramicrotomy.
- Biological samples: Pre-fixation (e.g., glutaraldehyde) and negative staining (e.g., phosphotungstic acid) recommended.
Particle Size Range
1 nm to several micrometers.
Key Advantages
- Atomic-level resolution: Visualize crystal structures, defects, and lattice arrangements.
- Elemental mapping: Integrated EDS for nanoscale elemental distribution analysis.
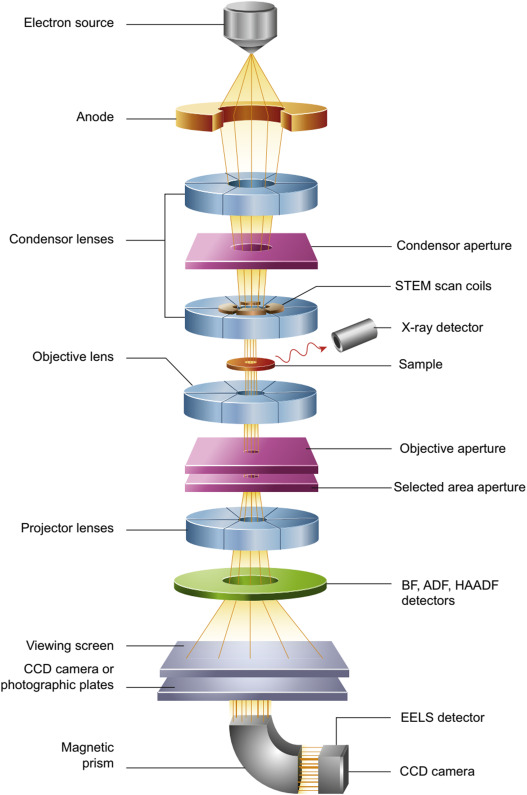 A schematic diagram of the transmission electron microscopy (Yadav H M, Shinde S K,
et al., 2022).
A schematic diagram of the transmission electron microscopy (Yadav H M, Shinde S K,
et al., 2022).
Scanning electron microscopy (SEM) analysis
A focused electron beam scans the sample surface, detecting secondary electrons (SE) and backscattered electrons (BSE) to reconstruct three-dimensional topography (1–5 nm resolution). Optimized for surface ultrastructure analysis of biological tissues, cells, and microparticles.
Sample Requirements
- Formats: Bulk solids, powders, or coated specimens.
- Non-conductive samples: Gold sputtering service available.
Particle Size Range
Tens of nanometers to millimeter-scale.
Key Advantages
- 3D visualization: Direct observation of particle aggregation and surface morphology.
- Large-area imaging: Automated stitching for high-throughput analysis.
- Elemental analysis: EDS integration for compositional mapping.
- Non-destructive: Enables repeated analysis of the same sample
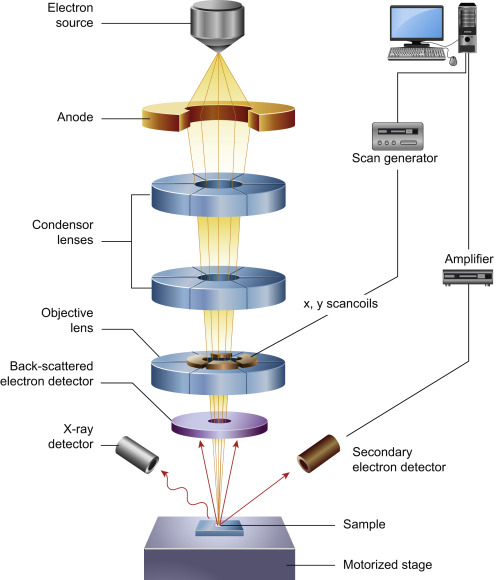 A schematic diagram of the Scanning electron microscopy (SEM) (Inkson B J,
2016).
A schematic diagram of the Scanning electron microscopy (SEM) (Inkson B J,
2016).
Key Features

Expert Team
PhD-led specialists with 10+ years of EM experience; customized solutions for complex projects.

Cutting-Edge Technology
Field-emission TEM/SEM platforms supporting cryo-EM and in situ analysis.

Tailored Solutions
Flexible protocols aligned with unique research or industrial needs.

Rapid Turnaround
Streamlined workflows ensure timely delivery (standard reports within 7–10 business days).
FAQ
What is the resolution difference between TEM and SEM?
TEM achieves sub-nanometer resolution for internal structures, while SEM provides superior surface topography at 1–5 nm resolution.
Can hydrated or sensitive samples be analyzed?
Yes, environmental SEM (ESEM) accommodates partially hydrated samples. Biological specimens require pre-fixation or freeze-drying.
What is included in the final report?
Raw images, size distribution histograms, elemental analysis tables (if applicable), and expert interpretations.
References
- Yadav H M, Shinde S K, et al. 2 - Metal oxide-based composites: synthesis and characterization. Elsevier Inc. 2022.
- Inkson BJ. Scanning electron microscopy (sem) and transmission electron microscopy (tem) for materials characterization. Materials Characterization Using Nondestructive Evaluation (NDE) Methods. 2016. 17-43.
Explore Other Options