How to Interpret CYP Phenotyping Data
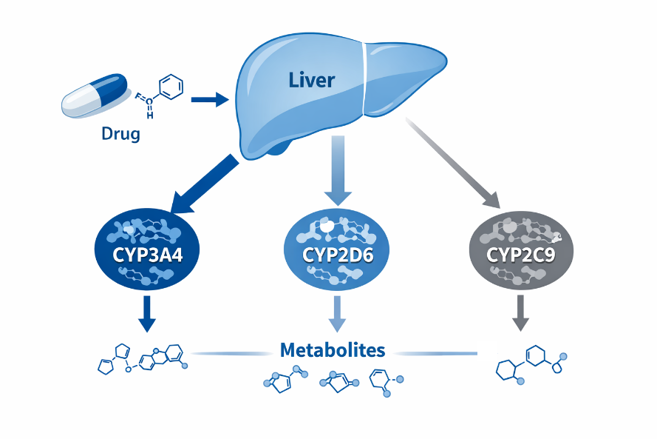
Drug metabolism often determines systemic drug exposure, efficacy, and safety during drug development. Elimination of small-molecule drugs is primarily mediated by enzymes of the cytochrome P450 (CYP450) superfamily in the human liver. Understanding which CYP enzymes metabolize a drug is therefore crucial to drug-drug interaction (DDI) risk assessment.
Most drug candidates are metabolized by multiple CYP enzymes, rather than a single pathway. Identifying which enzyme(s) contribute most to a compound's clearance is therefore essential. If a major metabolizing enzyme is inhibited or induced by a co-administered drug, plasma exposure may change substantially, leading to reduced efficacy or increased toxicity.
Unlike metabolic stability assays designed to understand how quickly a compound will be cleared from the body, CYP reaction phenotyping helps define which enzymes are responsible for clearance. Understanding this can be critical to predicting DDI risk and informing decisions related to clinical study design and regulatory filings.
Analyses of CYP phenotyping data include measurements of percent inhibition, metabolite formation rates, and intrinsic clearance (CLint = Vmax/Km). Improper analysis and interpretation of this data can result in under-predicted DDI liability and lead to misguided drug development decisions. Here we provide actionable steps and visualizations to take you through the process of interpreting CYP reaction phenotyping results, identifying major metabolizing enzymes, and applying that knowledge to drug development decisions.
A Stepwise Framework for Interpreting CYP Phenotyping Data
Step 1: Understand the Source of Your Data
CYP phenotyping is typically performed using two complementary in vitro approaches.
Chemical inhibition studies utilize selective enzyme inhibitors (ex: ketoconazole for CYP3A4, quinidine for CYP2D6) to measure the percent contribution of individual enzymes to overall oxidative metabolism in human liver microsomes (HLM). Percent inhibition and IC₅₀ values are determined by comparing metabolism with and without chemical inhibitor. This method can quickly identify enzymes responsible for clearance of your compound but care should be taken at high inhibitor concentrations that can become non-specific.
CYP recombinant enzyme studies use individually expressed human CYP isoforms to determine metabolite formation rates (nmol/min) and calculate CLint (Vmax/Km). Results from these studies need to be normalized to account for differences in enzyme activity in HLM by applying a relative activity factor (RAF) or inter-system extrapolation factor (ISEF) to the recombinant enzyme CLint values.
Supporting methods such as correlation analysis across multiple HLM donors and in silico predictions can provide additional context and strengthen conclusions when integrated using a weight-of-evidence approach.
Step 2: Normalize Data and Calculate Fraction Metabolized (fm)
Raw phenotyping data require normalization before interpretation. Recombinant CYP clearance values should be scaled using RAF or ISEF to reflect relative enzyme contributions in human liver.
The most informative metric derived from these studies is the fraction metabolized (fm):
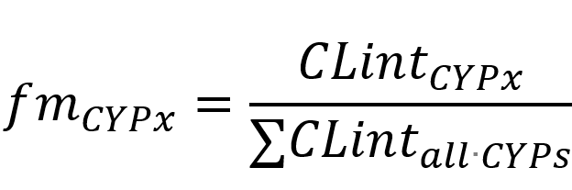
By definition, fm values represent the fraction of total oxidative metabolism that is mediated by each CYP enzyme. Although these values are only estimates, they have proven useful for identifying major metabolic pathways and making conservative predictions during DDI assessment. Organizing your data into pie charts or stacked bar graphs allows for quick visualization and interpretation.
Step 3: Identify the Major Metabolizing Enzyme
Typically, if a CYP enzyme has an fm ≥25-50% , that enzyme is considered a major metabolizing enzyme of your compound. If more than one enzyme falls into this category, both (or all) may need to be considered "major".
Ideally your chemical inhibition studies will agree with your findings from enzyme kinetics studies. If metabolism is completely abolished by a selective inhibitor that matches an enzyme you identified through enzyme kinetics, you can be very confident that enzyme is metabolizing your drug. Intermediate values of 20-30% are less black and white and should be evaluated with the rest of your data in context.
Step 4: Recognize Common Interpretation Pitfalls
Several factors can complicate CYP phenotyping interpretation:
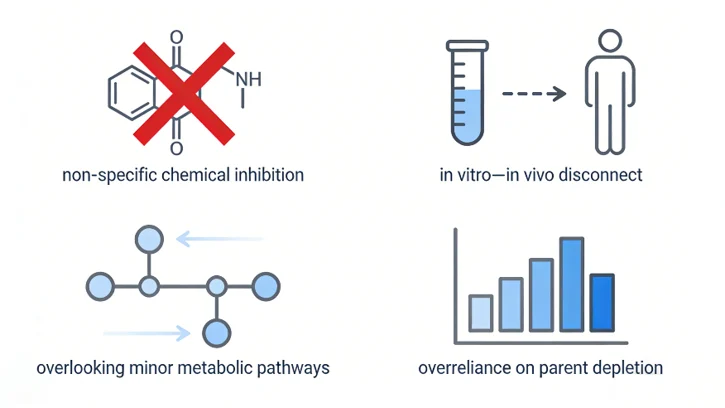
- Non-specific inhibition at high inhibitor concentrations
- Differences between in vitro enzyme activity and in vivo hepatic abundance
- Overlooking secondary metabolic pathways
- Overreliance on parent depletion without metabolite-specific analysis
Awareness of these limitations is essential for avoiding false conclusions.
Translating Phenotyping Data into Development Decisions
Proper interpretation of your CYP phenotype data can aid in:
1) Drug-Drug Interaction Risk Assessment
If you can identify a single major metabolic pathway, you can prioritize your DDI development resources to focus on the highest risk clinical drug interactions. You can use your fm values to quickly identify high-risk situations that should be covered in clinical drug interaction studies per FDA and EMA guidelines. Elimination of secondary pathways through in vitro inhibition or in vivo induction can simplify your drug's metabolic profile and reduce the likelihood of unknown DDIs in clinical trials.
2) Support Physiologically-Based Pharmacokinetic (PBPK) Modeling
The fraction metabolized values can be applied to develop PBPK models to simulate inhibition, induction, and changes in exposure that may be seen in special populations.
3) Gain Clarification on Unclear Results
When read-across or modeling is insufficient, you can always perform additional phenotyping experiments to determine your drug's major metabolic pathways. Kinetic studies with additional selective inhibitors or testing across multiple human liver microsome donors can help make sense of complex phenotyping data.
However, if you have tried all of the above and are still left with more questions than answers, consider partnering with a contract research organization (CRO) with extensive experience in in vitro ADME and CYP phenotype interpretation. They can help reduce risk by increasing confidence in your metabolic exclusivity predictions.
Creative Bioarray Relevant Recommendations
| Products & Services | Description |
|---|---|
| CYP and UGT Reaction Phenotyping Assay | Creative Bioarray helps provide CYP and UGT reaction phenotyping assay, with years of experience and excellent scientific team to provide you with quality service. |
| Drug-Drug Interaction | Creative Bioarray provides a range of high-quality drug-drug interaction services to meet FDA and EMA guidance. |