LA1-5s
Cat.No.: CSC-C9416J
Species: Homo sapiens (Human)
Source: Bone Marrow Metastasis
- Specification
- Background
- Scientific Data
- Q & A
- Customer Review
LA1‑5s human cancer cell line was developed as a clonal subline of the LA‑N‑1 human neuroblastoma line by Seeger et al. in 1977 from a metastasis to bone marrow of stage IV neuroblastoma of an infant. Cell morphology of LA1‑5s cells is substrate‑adherent "S‑type" (cells are large, flat, and grow as a tight monolayer when maintained in culture). These cells most closely resemble cells of Schwann cell/glia/melanocyte precursor lineage from the neural crest. While LA1‑5s have amplification of the N‑myc oncogene like all LA‑N‑1 sublines, they characteristically express little N‑myc protein unlike more neuroblastic sublines. LA1‑5s cells fail to cause tumors in nude mice, even at high inocula, and has been used as a model for aspects of neuroblastoma biology that do not require overt tumorigenicity.
LA1‑5s, as well as LA‑N‑1 and LA1‑55n, were confirmed by STR profiling to have been derived from the same patient. Given its origin as a neural‑crest‑derived non‑tumorigenic subline of neuroblastoma cells, LA1‑5s has been used to study neural differentiation, lineage plasticity, and neural crest precursor cell biology, among other properties.
Multiomics Analysis of Neuroblastoma Cells Reveals a Diversity of Malignant Transformations
Neuroblastoma (NB) is a pediatric cancer with heterogeneous differentiation stages. Global DNA methylation loss and 5-hydroxymethylcytosine (5hmC) alterations are cancer hallmarks. Narmontė et al. used single-base resolution methods (hmTOP-seq, uTOP-seq) to construct 5hmC maps and identify partially methylated domains (PMDs) in NB cell subpopulations, aiming to uncover lineage-specific epigenetic signatures and their clinical relevance.
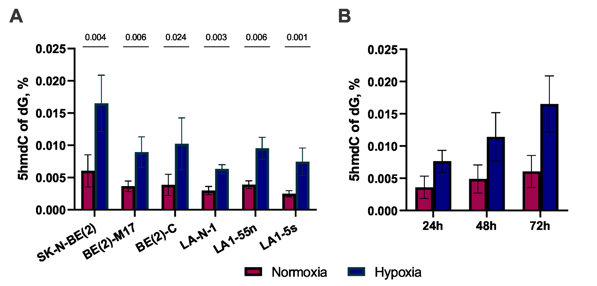
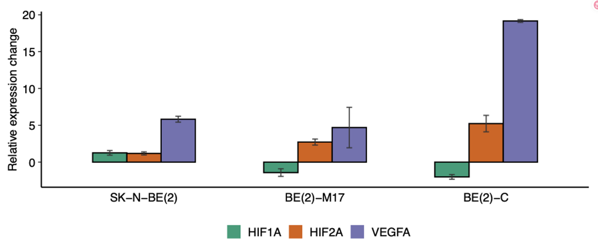
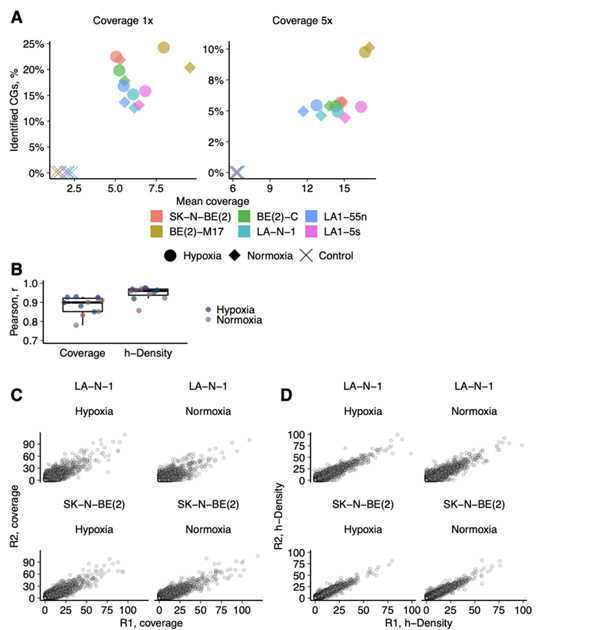
They evaluated 5hmC levels in NB cell lines and subpopulations, BE(2)-C (I-type) and BE(2)-M17 (N-type), and LA1-55n (N-type) and LA1-5s (S-type), by HPLC-MS/MS (Fig. 1A, B). All samples showed low global 5hmC (0.0025-0.006%) versus neural tissues. Hypoxia increased 5hmC 2.5-fold without affecting 5mC, confirmed by elevated HIF-1α/2α (Fig. 2). Genome-wide 5hmCG mapping identified 1.67 M genomic CGs (5.9%) with good replicate correlation (r = 0.88), plus ~30,000 5hmCH sites (Fig. 3A, D). h-density normalization improved correlation to 0.95 (Fig. 3B, C). 5hmCG and h-density were enriched in enhancers, introns, 3'UTRs, CGI shores/shelves, and HIF-2 response elements, but depleted in intergenic regions. Non-coding RNAs and transcribed processed pseudogenes showed highest enrichment, linking 5hmC to active transcription.
Ask a Question
Write your own review
Description: Subline of GOTO. Protein-free medium adapted. Cell growth is slow.


Description: Established from the adrenal tumor tissue resected after treatment from a 20-month-old boy of European origin with neuroblastoma (stage III) in 1991
Description: established from the bone marrow metastasis of a 1-year-old female patient with adrenal gland neuroblastoma negative

Description: The line is resistant to infection and focus formation by ecotropic MuLV.
Description: Established from the primary adrenal tumor resected prior to treatment from a 3-year-old boy with rapidly progressing Stage III neuroblastoma in 1989; described to lack MYCN (NMYC, N-myc) ...
- Adipose Tissue-Derived Stem Cells
- Human Neurons
- Mouse Probe
- Whole Chromosome Painting Probes
- Hepatic Cells
- Renal Cells
- In Vitro ADME Kits
- Tissue Microarray
- Tissue Blocks
- Tissue Sections
- FFPE Cell Pellet
- Probe
- Centromere Probes
- Telomere Probes
- Satellite Enumeration Probes
- Subtelomere Specific Probes
- Bacterial Probes
- ISH/FISH Probes
- Exosome Isolation Kit
- Human Adult Stem Cells
- Mouse Stem Cells
- iPSCs
- Mouse Embryonic Stem Cells
- iPSC Differentiation Kits
- Mesenchymal Stem Cells
- Immortalized Human Cells
- Immortalized Murine Cells
- Cell Immortalization Kit
- Adipose Cells
- Cardiac Cells
- Dermal Cells
- Epidermal Cells
- Peripheral Blood Mononuclear Cells
- Umbilical Cord Cells
- Monkey Primary Cells
- Mouse Primary Cells
- Breast Tumor Cells
- Colorectal Tumor Cells
- Esophageal Tumor Cells
- Lung Tumor Cells
- Leukemia/Lymphoma/Myeloma Cells
- Ovarian Tumor Cells
- Pancreatic Tumor Cells
- Mouse Tumor Cells