
- Specification
- Background
- Scientific Data
- Q & A
- Customer Review
LS 123 is a human colorectal adenocarcinoma line established from a primary tumor resected from the large intestine. It grows as an adherent epithelial monolayer and is characterized by polygonal to round cells that form tight, often two‑to three‑cell‑thick, layers. The cells proliferate modestly in standard EMEM or MEM/1640 supplemented with 10 % fetal bovine serum and 1 % penicillin/streptomycin, and can also be propagated in both low‑serum and serum‑free conditions. LS 123 demonstrates low invasiveness in both chick embryo and nude mouse xenograft models, which is consistent with the indolent clinical course of the donor tumor.
Functionally, LS 123 cells express a number of molecular markers associated with colorectal cancers (e.g., carcinoembryonic antigen, CEA), and harbor a number of genetic alterations associated with colorectal carcinogenesis, including activating mutations in KRAS, a critical mediator of colorectal cancer progression. LS 123 is commonly used in studies of the pathogenesis of colorectal cancer, particularly the mechanisms underlying tumorigenesis of the ascending colon. The line is also used as a model of colorectal cancer in in vitro screens for chemotherapeutic (e.g., 5-fluorouracil, oxaliplatin) and targeted (anti-KRAS mutant colorectal cancer) therapies, as well as for the study of tumor-stroma interactions and mechanisms of drug resistance.
A Subgroup of CRC Cells Displays Drastically Reduced Mitochondrial Biomass
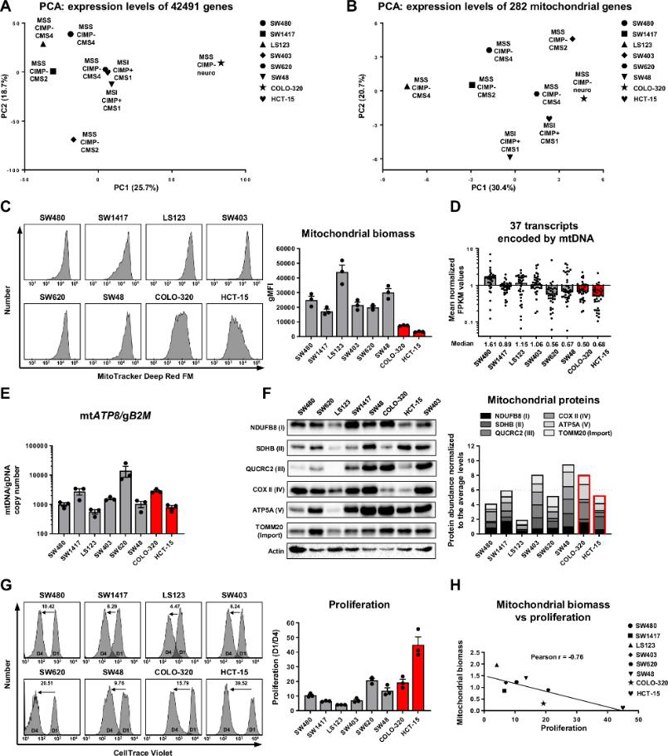
Mitochondria are central to the metabolic reprogramming in cancer cells, supporting their growth and survival. The extent of mitochondrial heterogeneity in cancer remains unclear. Markov et al. examined mitochondrial heterogeneity in colorectal cancer (CRC) using a panel of cell lines (SW480, SW1417, LS123, SW403, SW620, SW48, COLO-320 and HCT-15).
To evaluate mitochondrial function in the cells, they assessed mitochondrial biomass using two MitoTracker stainings (Fig. 1C), revealing the highest mitochondrial levels in LS123 and drastically reduced levels in COLO-320 and HCT-15. They then examined mtDNA transcript levels, finding diminished levels in SW620, SW48, COLO-320, and HCT-15, suggesting reduced mitochondria or impaired mtDNA maintenance (Fig. 1D). MtDNA copy numbers were high in all cell lines, indicating functional mtDNA maintenance (Fig. 1E). However, nuclear-encoded mitochondrial gene expression was lowest in LS123. Western blot analysis showed the lowest mitochondrial protein density in LS123 (Fig. 1F). Considering cell volume as a significant variable, they calculated relative cell volumes and mitochondrial densities. Normalized for cell volume, SW403 and SW48 had the highest mitochondrial densities, while COLO-320 and HCT-15 had the lowest. These findings suggest that impaired mitochondrial assembly or turnover, rather than nuclear gene expression, mainly accounts for reduced mitochondrial biomass in COLO-320 and HCT-15.
Validation of EGFR Inhibitor-Sensitive RAS Mutants in Additional Model Systems
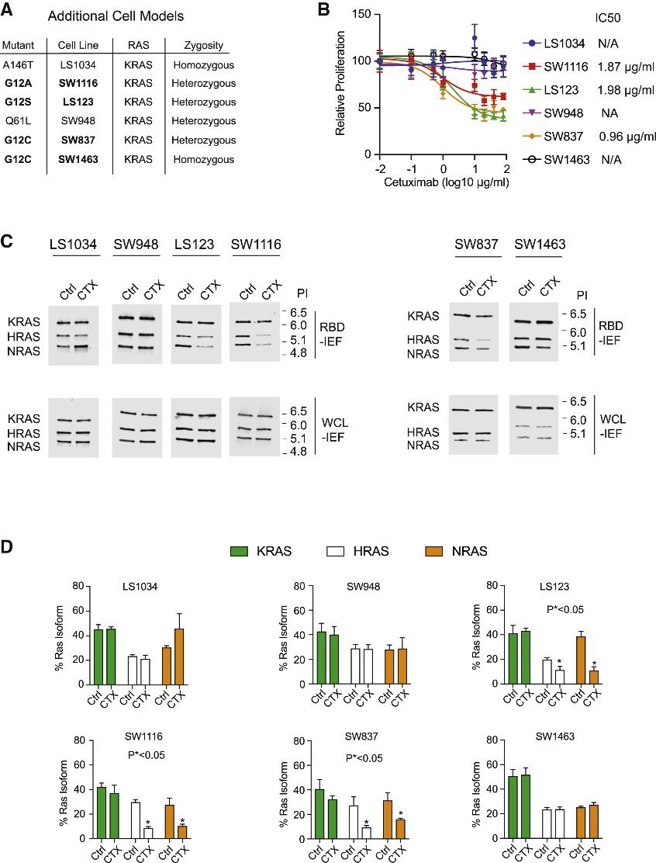
Matching cancer patients with effective treatments based on tumor genomes is a major challenge in cancer medicine. RAS mutations, particularly KRAS, are biomarkers for resistance to EGFR-targeted therapies. However, KRAS G13D is an exception, showing sensitivity to EGFR inhibitors. McFall et al. aim to identify additional RAS mutations that retain sensitivity to EGFR inhibition by investigating the biophysical biomarker of impaired binding to the tumor suppressor Neurofibromin (NF1).
Their prior experimental data utilized SW48 heterozygous RAS mutant isogenic cells. To evaluate generalizability, they tested four colon cancer cell lines with RAS mutations associated with sensitivity to EGFR inhibition and two with mutations linked to resistance (Fig. 2A). All six cell lines are NF1 WT. Cetuximab significantly reduced growth in LS123 (KRAS G12S), SW1116 (KRAS G12A), and SW837 (KRAS G12C) cells, but not in LS1034 (KRAS A146T), SW948 (KRAS Q61L), or SW1463 (KRAS G12C) cells (Fig. 2B). Colony formation assays confirmed these results (Fig. 2A). Long-term EGF depletion showed that only the sensitive cell lines relied on EGF for colony formation. RBD-IEF analysis revealed significant reductions in WT RAS-GTP in the sensitive cell lines (Fig. 2C, D), while no changes were observed in the resistant cell lines. Notably, the G12C homozygous SW1463 cells showed no change in WT RAS-GTP levels upon cetuximab treatment, suggesting that the increased dosage of KRAS G12C may overcome reduced affinity and maintain high WT RAS-GTP levels.
Ask a Question
Write your own review

Description: Established from an adenocarcinoma located in the ascending colon of a 68 year-old male patient. The adenocarcinoma was well differentiated and determined to be Dukes' stage B. Imperial College ...

Description: This is one cell line out of a series of colon carcinoma cell lines established by PD Dr. Michael Linnebacher.
Description: Rectal carcinoma from a Japanese patient. Cell growth is slow.
Description: The C80 cell line was established from a 69-year old male patient with a moderately well differentiated adenocarcinoma of the rectum classified as Dukes' stage D.
Description: RKO is a poorly differentiated colon carcinoma cell line developed by Michael Brattain.
- Adipose Tissue-Derived Stem Cells
- Human Neurons
- Mouse Probe
- Whole Chromosome Painting Probes
- Hepatic Cells
- Renal Cells
- In Vitro ADME Kits
- Tissue Microarray
- Tissue Blocks
- Tissue Sections
- FFPE Cell Pellet
- Probe
- Centromere Probes
- Telomere Probes
- Satellite Enumeration Probes
- Subtelomere Specific Probes
- Bacterial Probes
- ISH/FISH Probes
- Exosome Isolation Kit
- Human Adult Stem Cells
- Mouse Stem Cells
- iPSCs
- Mouse Embryonic Stem Cells
- iPSC Differentiation Kits
- Mesenchymal Stem Cells
- Immortalized Human Cells
- Immortalized Murine Cells
- Cell Immortalization Kit
- Adipose Cells
- Cardiac Cells
- Dermal Cells
- Epidermal Cells
- Peripheral Blood Mononuclear Cells
- Umbilical Cord Cells
- Monkey Primary Cells
- Mouse Primary Cells
- Breast Tumor Cells
- Colorectal Tumor Cells
- Esophageal Tumor Cells
- Lung Tumor Cells
- Leukemia/Lymphoma/Myeloma Cells
- Ovarian Tumor Cells
- Pancreatic Tumor Cells
- Mouse Tumor Cells