Flow-FISH Protocol for Analyzing Telomere
GUIDELINE
- Flow cytometry is a well-established method for rapid detection of fluorescence signals in individual cells in suspension which has been applied to FISH studies using chromosome-specific probes. Recently, flow cytometry using a fluorescently labeled peptide nucleic acid (PNA) probe was used to estimate the telomere length in individual cells.
- In the present study we have adopted this approach to develop an improved flow cytometric FISH technique that gives telomere length values within 30 h.
METHODS
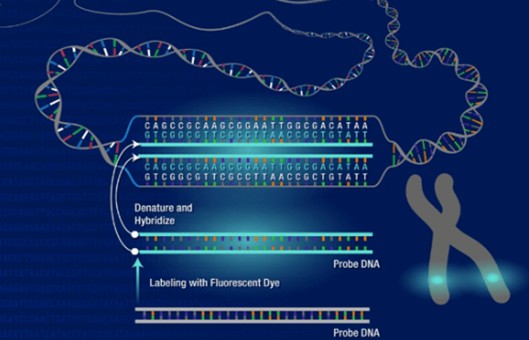
Peptide nucleic acid (PNA) synthesis and labeling
The (CCCTAA)3 PNA probe was synthesized using the Nucleic Acid Synthesis System and was labeled at both the N- and C-termini with lysine-(5(6)-carboxyfluorescein). The probe was purified by reverse phase HPLC at 50°C and characterized by MALDI-TOF MS. The molecular weight was found to be within 0.1% of the calculated molecular weight.
Fluorescence in situ hybridization
- Fresh cell suspensions were washed in phosphate-buffered saline (PBS), centrifuged at 400 g for 5 min, and resuspended in 1 ml PBS.
- Cells frozen in DMSO were rapidly thawed, washed three times, and resuspended in 1 ml PBS.
- The cells were stained with 1 mg/ml Trypan blue and counted in a Bürker chamber. The cell suspensions were mixed 1:1 with 1301 cells and a total of 2×10⁶ mixed cells were collected in 1.5 ml tubes. PBS was added and the tubes were centrifuged at 4900 g for 30 s.
- The pellets were resuspended in 400 µl Fix & Perm Reagent A and incubated for 15 min at room temperature.
- An aliquot of 1 ml PBS was added to each tube and after centrifugation, the pellets were resuspended in 400 µl Fix & Perm Reagent B.
- After incubation for 15 min, the cells were washed twice in PBS.
- Thereafter, 5 × 10⁵ cells were collected in new Eppendorf tubes, PBS was added and after centrifugation, the supernatants were removed.
- The pellets were resuspended in a hybridization mixture containing 70% formamide, 1% Blocking Reagent, and 4 nM fluorescein-(CCCTAA)3-fluorescein PNA probe in 10 mM Tris, pH 7.2.
- After incubation for 10 min at room temperature the tubes were carefully vortexed and placed in a water bath at 87°C for 10 min with continuous shaking.
- The tubes were placed in the dark at room temperature overnight (15-20 h), whereafter the cells were centrifuged and incubated twice at room temperature for 10 min in 70% formamide, 0.1% BSA, and 0.1% Tween 20 in 10 mM Tris, pH 7.2.
- The cells were then resuspended in 1 ml 0.15 M NaCl, 0.1% BSA, 0.1% Tween 20 in 50 mM Tris, pH 7.5, and transferred to 5 ml tubes.
- An additional 3-4 ml 0.15 M NaCl, 0.1% BSA, 0.1% Tween 20 in 50 mM Tris, pH 7.5, was added and after 10 min at room temperature, the tubes were centrifuged at 400 g for 5 min.
- The cells were resuspended in 0.5 ml PBS and 20-30 µl were used for cytocentrifugation onto glass slides and covered by Mounting Medium containing 0.025-0.1 µg/ml propidium iodide and 2.5% DABCO.
- Propidium iodide was added to the remaining suspensions in a final concentration of 0.1 µg/ml, vortexed, and then kept in the dark at 4°C for at least 30 min until flow cytometric analysis.
Flow cytometry
- The analysis was performed in a flow cytometer, using the FL1 channel for the detection of fluorescein signal and the FL3 channel for propidium iodide.
- List mode data from 104 cells in each experiment were collected and analyzed using the software.
- The telomere fluorescence signal was defined as the mean fluorescence signal in G0/G1 cells after subtraction of the background fluorescence signal (i.e. FISH procedure without probe). The relative telomere length value was calculated as the ratio between the telomere signal of each sample and the control cell line (1301) with compensation for the DNA index of G0/G1 cells.
Densitometry and evaluation of the length of telomere fragments
- Autoradiographs were scanned with a densitometer. Mean telomere restriction fragment length (TRF) was defined as (ODi)/(ODi/Li), where ODi is the densitometer output and Li is the length of DNA at position i. Sums were calculated over the range 2-26 kb.
- Telomere peak values were measured by estimating the band size corresponding to the point with the highest optical density within the peak.
Creative Bioarray Relevant Recommendations
- Flow FISH telomere detection has unique advantages compared with other detection schemes because it can provide results of various cell types from one sample. Creative Bioarray provides Flow-FISH Service with a unique agreement for each customer. Our customers will benefit from our technical expertise and integrated laboratory platform, to perform relevant analytical tests quickly and with high quality.
RELATED PRODUCTS & SERVICES
Reference
- Hultdin M, et al. (1998). "Telomere analysis by fluorescence in situ hybridization and flow cytometry." Nucleic Acids Res. 26 (16), 3651-6.