Data Analysis in Flow Cytometry
Flow cytometry data analysis has been considered as the most critical parameter in biological experiments. The major principle of data analysis is to selectively display the cells of interest and to find out more about your cells. This method is referred to as "gating" in flow cytometry, as well as a gate can be defined as a combination of one or more regions. The region is a set of points that are carefully selected by the user, determining an area on the graph. These parameters can provide you with an opportunity to eliminate the consequences from unwanted particles such as dead cells and debris.
Gates and Regions
Gates and regions are placed around cell populations with common characteristics, typically forward scatter, side scatter and marker expression, to investigate and quantify these populations of interest. Forward scatter and side scatter give an assessment of the size and granularity of the cells respectively. For cell lines with only one cell type, it is relatively straight forward to distinguish cell populations, but for samples with multiple cell types, it can be more complicated. For example, in a blood sample containing a mixed population of cells, the light scatter patterns of granulocytes, monocytes and lymphocytes enable them to be distinguished from cellular debris and dead cells. Lymphocytes can be analyzed by setting a gate on the FSC versus SSC plot.
The data can be displayed by several different plot types, which one is preferred depends on your preferences.
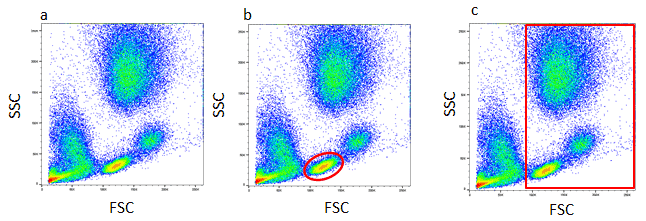 Figure 1. Analysis of lysed whole blood.
Single Parameter Analysis
The histogram is a single parameter plot where the x-axis represents the parameter’s signal value in the channel and the y-axis represents the number of events per channel. Each event placed in the channel corresponds to its signal value. Signals with the same intensities accumulate in the same channel. The brighter signals are displayed in channels to the right of the dimmer signals. Ideally, flow cytometry will produce a single distinct peak. However, flow analysis is sometimes marked on a mixed population of cells resulting in several peaks on the histogram.
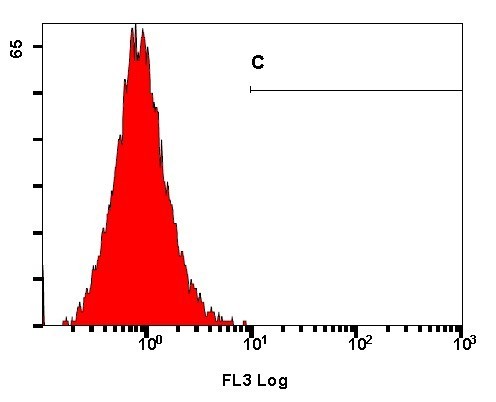 Figure 2. The histogram shows the total number of cells expressing the marker of interest.
Two Parameter Analysis
Alternate methods of data display are available for two parameter plots. These graphs display two measurement parameters, one on the x-axis and the other on the y-axis and the cell count as a density (dot) plot or contour plot. Dot plot provides a two-parameter display of the data and each dot represents one or more events (particles), while density plot displays two parameters as a frequency distribution. The color is used to code the different frequencies of events in density plot. The contour plot is the same as density plot, except the density of the cells is represented by contour line. A quadrant marker divides two-parameter plots into four sections to discriminate cell populations as negative, single positive or double positive. The upper-right quadrant of the plot indicates cells positive for both fluorescent marker (double positive). The lower-left quadrant shows events that are negative for both markers. The upper-left quadrant of the plot represents cells only positive for the y-axis parameter. The lower-right quadrant contains events that are positive for the x-axis marker but negative for the y-axis fluorescent marker.
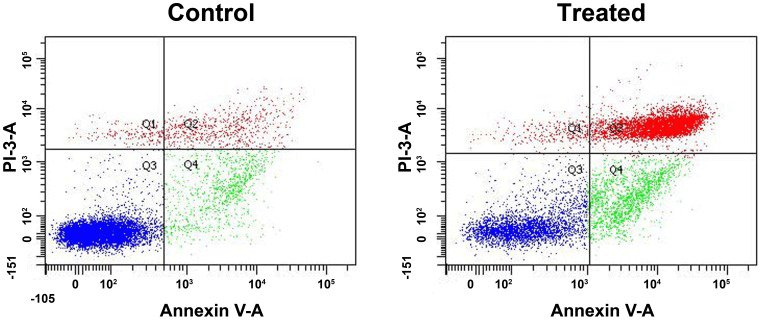 Figure 3. Flow cytometric analysis of Annexin V-FITC/PI.
References
- Lugli E. et al.; Data analysis in flow cytometry: the future just started. Cytometry A. 2010, 77(7): 705-713.
- Aghaeepour N. et al.; Critical assessment of automated flow cytometry data analysis techniques. Nature Methods, 2013, 10: 228-238.
- Aysun Adan, et al.; Flow cytometry: basic principles and applications. Critical Reviews in Biotechnology, 2017, 37(2): 163-176.
Cell Services:
Cell Line Testing and Assays: