Rat Urinary Bladder Smooth Muscle Cells
Cat.No.: CSC-C9375W
Species: Rat
Source: Bladder
Morphology: Multipolar
Cell Type: Smooth Muscle Cell
- Specification
- Background
- Scientific Data
- Q & A
- Customer Review
Rat Urinary Bladder Smooth Muscle Cells are smooth muscle cells derived from the smooth muscle layer (detrusor) of rat urinary bladder. These cells contract to produce force during bladder emptying and are critical for normal bladder function. Bladder smooth muscle cells (SMCs) contract in a coordinated manner to facilitate urine storage at low pressure and expulsion during voiding. Cells maintain a spindle-shaped morphology in culture and express smooth muscle specific markers including α-smooth muscle actin (α-SMA), smooth muscle myosin heavy chain (SM-MHC), calponin and SM22α. Bladder SMCs can be stimulated by a variety of neurotransmitters, hormones and drugs including agents that act via cholinergic and adrenergic receptors.
These cells are commonly used to study basic cell biology and physiology of the urinary bladder. These cells have been used to study smooth muscle contraction, calcium signaling, receptor function, and extracellular matrix remodeling. Increased proliferation and/or phenotypic switch of bladder smooth muscle cells have been implicated in many bladder diseases such as overactive bladder, bladder outlet obstruction, detrusor hypertrophy and fibrosis.
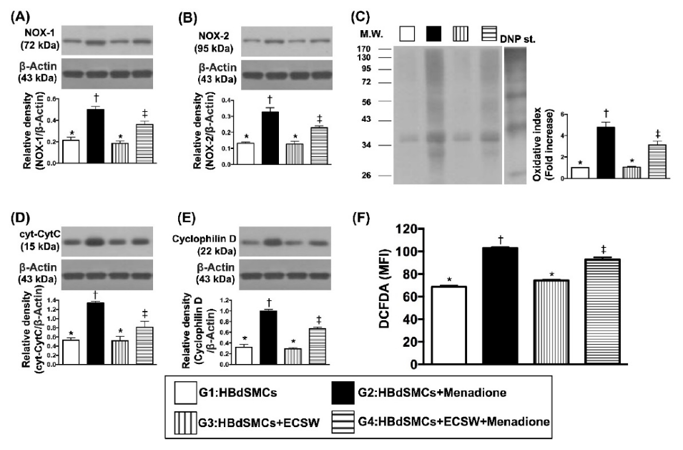
Impact of ECSW Therapy on Protecting the Rat Bladder Smooth Muscle Cells (RBdSMCs) against Oxidative Stress and Mitochondrial Damage
In this study, Chen et al. evaluated whether ECSW treatment can prevent ketamine-induced impairments in rat urinary bladder function and histology. Rat bladder smooth muscle cells (RBdSMCs) were isolated and exposed to experimental conditions in vitro, and then separated into four groups: sham-control group (G1), menadione group (G2), ECSW group (G3), and menadione + ECSW group (G4).
Western blot results revealed oxidative stress biomarkers (NOX-1, NOX-2, oxidized protein) were significantly increased in group G2 and significantly higher in group G4 compared to groups G1 and G3, with no significant difference between groups G1 and G3. Flow cytometry analysis of DCFH-DA reactive fluorescence demonstrated a similar trend for total cellular oxidative stress (Fig. 1). Biomarkers for mitochondrial damage (cytosolic cytochrome-C, cyclophilin-D) trended identical between groups.
Ask a Question
Write your own review

Description: The thoracic aorta is located in the chest cavity and gives off arteries that branch to the esophagus, pericardium, lungs, and trachea. The thoracic aorta can be subdivided into the ascending aorta, ...

Description: Rat Podocytes are isolated from normal rat kidney. The cells are characterized by immunofluorescence with antibodies specific to podocin, Ang1, Nephrin, ACTN4, NPHS2. T25 flasks is required for cell ...

Description: Rat Bronchial Smooth Muscle Cells are isolated from normal rat bronchi tissue. Rat Bronchial Smooth Muscle Cells are characterized by immunofluorescence with antibodies specific to alpha-actin. T25 ...

Description: Guinea Pig Endothelial Cells from Creative Bioarray are isolated from guinea pig tissue. Prior to shipping, cells at passage 2 are detached from flasks and immediately cryopreserved in vials. Each ...

Description: Rat Lung Epithelial Cells are isolated from normal rat lung tissue. The cells are characterized by immunofluorescence with antibodies specific to CK-18, CK-19. T25 flasks is required for cell ...

Description: Rat Vein Endothelial Cells from Creative Bioarray are isolated from inferior vena cava tissue of 6-8 week old laboratory Sprague-Dawley rat. Rat Vein Endothelial Cells are grown in T75 tissue culture ...