
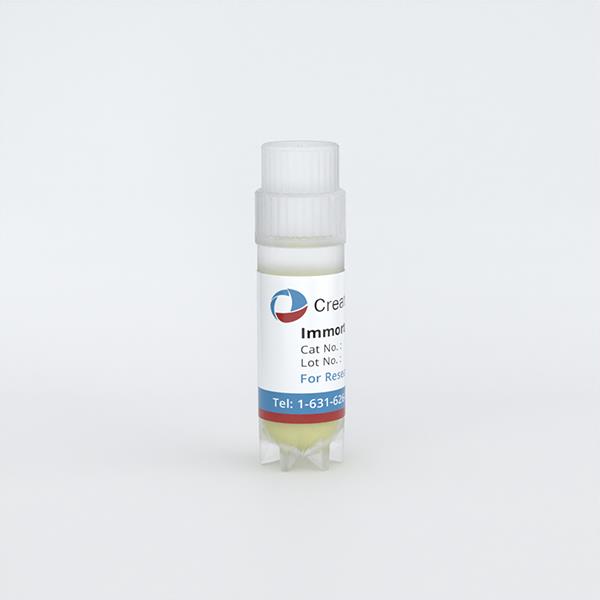
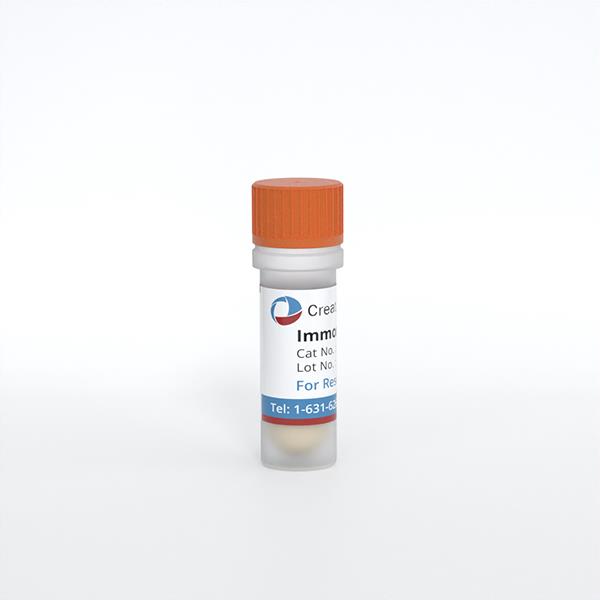
Immortalized Human Keratocytes (HPV16 E6/E7)
Cat.No.: CSC-I2093Z
Species: homo sapiens
Morphology: Polygonal
Culture Properties: Adherent
- Specification
- Background
- Scientific Data
- Q & A
- Customer Review
free from contaminations (bacteria incl. mycoplasma, fungi, HIV, HAV, HBV, HCV, Parvo-B19) and cross-contaminations
Note: Never can cells be kept at -20°C.
Immortalized Human Keratocytes (HPV16 E6/E7) are human corneal stromal keratocyte-derived cells that have been immortalized by stable expression of the human papillomavirus type 16 (HPV16) E6 and E7 oncogenes. The predominant resident cells of the corneal stroma are keratocytes, which are essential for corneal transparency, organization of the extracellular matrix, and stromal homeostasis. Keratocytes in their original form govern the synthesis of collagen types I and V, keratan sulfate proteoglycans, and other stromal matrix components critical for corneal biomechanics and optical clarity.
Immortalized Human Keratocytes (HPV16 E6/E7) have important functional properties of corneal stromal cells including fibroblast-like shape, susceptibility to growth factors such as TGF-β and FGF, and the ability to rebuild extracellular matrix and engage in wound healing processes. These cells represent a stable and reproducible in vitro model for long-term experimental studies compared to primary keratocytes.
These cells are commonly employed in ophthalmic researches such as corneal wound healing, fibrosis (corneal scarring), stromal cell differentiation, keratocyte-to-myofibroblast transition, and biomaterial evaluation for corneal restoration. They are also beneficial for studies of virus-host interactions, oxidative stress responses and signaling pathways involved in maintaining corneal transparency.
Epithelial Cell Response to Titanium and Zirconia-Coated Titanium Surfaces
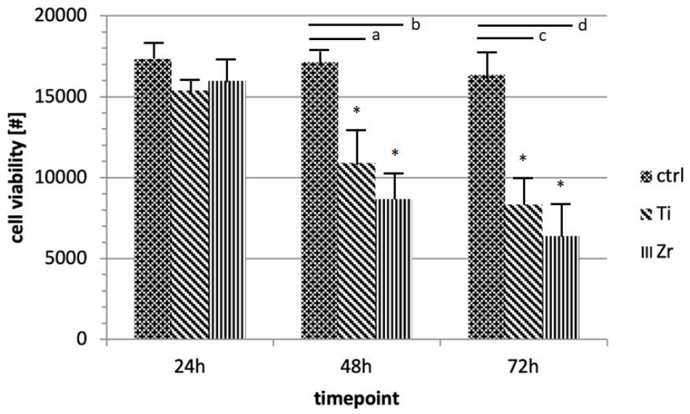
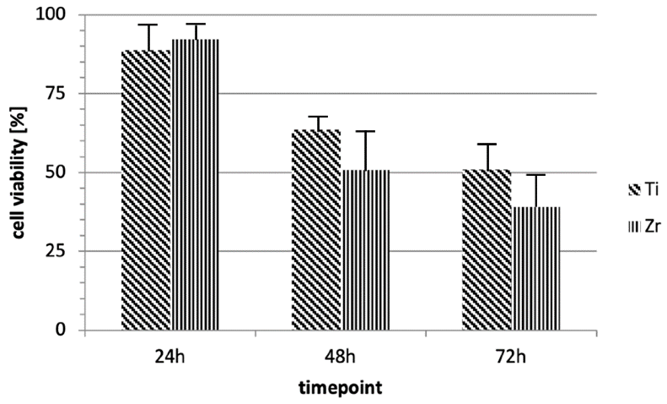
Memè et al. compared the epithelial biological response to machined titanium Ti-6Al-4V grade 5 (T1) and the same alloy coated with zirconia nitride (ZrN) via physical vapor deposition (T2). Human immortalized keratinocytes (HUKE) were cultured with T1 and T2 discs, alongside untreated controls (C). Surface characterization using scanning electron microscopy (SEM) and energy-dispersive spectroscopy (EDS) confirmed compositional and structural differences between T1 and T2.
Cell viability was assessed at 24, 48, and 72 h using trypan blue and MTT assays. Both T1 and T2 significantly reduced keratinocyte viability compared to C (p < 0.05), but no significant difference was observed between the two materials (Figs. 1, 2). These findings indicate that while both surfaces adversely affect epithelial cell viability, zirconia coating did not confer additional biological benefit under the tested conditions.
Ask a Question
Write your own review
Description: Nasal epithelial cells form the outermost protective layer against environmental factors. They clean, humidify, and warm inhaled air. They produces mucus, which binds particles that are subsequently ...
Description: Immortalized Human Splenic Endothelial Cells-SV40 have been obtained immortalizing Human Splenic Endothelial Cells with SV40LT expressing lentiviral particles. Immortalized cells were controlled ...
Description: Immortalized Human Corneal Epithelial Cells-SV40 have been obtained immortalizing Human Corneal Epithelial Cells with Lenti-SV40 Lentivirus. Immortalized cells were controlled passaging side by side ...
Description: Immortalized Human Lymphatic Endothelial Cells-SV40 were developed from human tissues transduced with a lentiviral expression vector containing the SV40T gene. The cell line was continuously cultured ...
- Adipose Tissue-Derived Stem Cells
- Human Neurons
- Mouse Probe
- Whole Chromosome Painting Probes
- Hepatic Cells
- Renal Cells
- In Vitro ADME Kits
- Tissue Microarray
- Tissue Blocks
- Tissue Sections
- FFPE Cell Pellet
- Probe
- Centromere Probes
- Telomere Probes
- Satellite Enumeration Probes
- Subtelomere Specific Probes
- Bacterial Probes
- ISH/FISH Probes
- Exosome Isolation Kit
- Human Adult Stem Cells
- Mouse Stem Cells
- iPSCs
- Mouse Embryonic Stem Cells
- iPSC Differentiation Kits
- Mesenchymal Stem Cells
- Immortalized Human Cells
- Immortalized Murine Cells
- Cell Immortalization Kit
- Adipose Cells
- Cardiac Cells
- Dermal Cells
- Epidermal Cells
- Peripheral Blood Mononuclear Cells
- Umbilical Cord Cells
- Monkey Primary Cells
- Mouse Primary Cells
- Breast Tumor Cells
- Colorectal Tumor Cells
- Esophageal Tumor Cells
- Lung Tumor Cells
- Leukemia/Lymphoma/Myeloma Cells
- Ovarian Tumor Cells
- Pancreatic Tumor Cells
- Mouse Tumor Cells