
KE-39
Cat.No.: CSC-C6378J
Species: Homo sapiens (Human)
Source: Lymph Node Metastasis
Morphology: epithelial-like
Culture Properties: Adherent cells
- Specification
- Background
- Scientific Data
- Q & A
- Customer Review
Store in liquid nitrogen.
The KE-39 cell line is a human cell line that was derived from a gastric cancer sample. As a model system, the KE-39 cells provide researchers with a valuable tool for investigating the biological characteristics and molecular mechanisms underlying gastric cancer.
By having access to the KE-39 cell line, researchers can explore the genetic alterations, signaling pathways, and other factors that contribute to the development and progression of gastric cancer. This includes investigating the potential roles of oncogenes, tumor suppressor genes, and other molecular drivers in the transformation and proliferation of gastric cancer cells. Furthermore, the KE-39 model has been utilized in preclinical drug screening and evaluation of novel therapeutic strategies targeting gastric cancer. The availability of this cell line has enabled researchers to assess the efficacy and mechanism of action of candidate compounds, which can inform the development of more effective treatment options for patients diagnosed with this type of cancer.
Identifying Upstream and Downstream Genes in KRAS-Amp Cancer Cell Lines
Gastroesophageal adenocarcinomas (GEAs) harbor recurrent amplification of KRAS, leading to marked overexpression of WT KRAS protein. SHP2 phosphatase, which acts to promote KRAS and downstream MAPK pathway activation, is a target in these tumors when combined with MEK inhibition. A custom, focused, secondary screening, CRISPR/Cas9 sgRNA library, was designed. In addition to those targeting genes of interest (Fig. 1A), 3 KRAS-amp cancer cell lines were screened, including 2 cancer cell lines (KE-39 and YCC-1) and 1 patient-derived cell line (CAT12) (Fig.1B-D).
The KE-39 cell line was first evaluated. BRAF, CRAF (RAF1), and SHOC2 were among the top depleted genes (denoting sensitization to SHP2i), and NF1 and PTEN were among the top enriched hits (denoting resistance). The composite group of KRAS-amp models was then evaluated from the secondary screen. Again, NF1 was the top enriched gene when silenced. On average, the top 10 depleted genes were SHOC2, RIC1, GAREM1, CRKL, RAPGEF1, RUNX1, BRAF, TCF7L2, CHD2, and VPS16 in the KRAS-amp cells. These included genes related to the MAPK pathway but also others, including RIC1, GAREM1, CRKL, RUNX1, TCF7L2, CHD2, and VPS16.
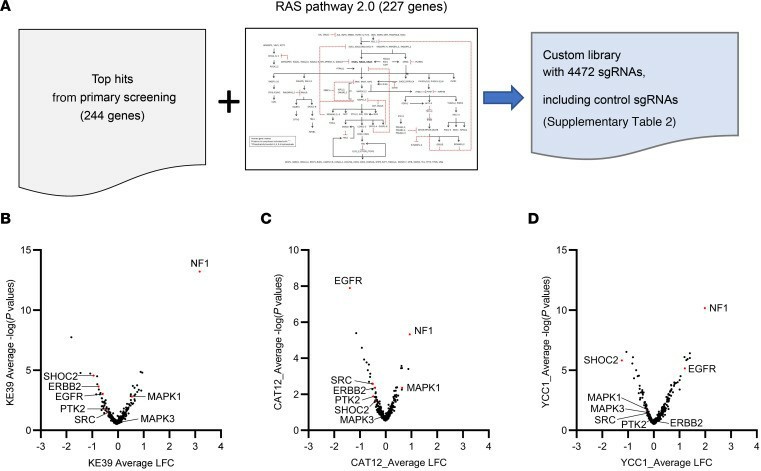 Fig. 1 Both genes upstream and downstream of KRAS are potential targets to enhance SHP2i efficacy. (Li T, et al., 2023)
Correlations Between Ploidy Defects and DDR Pathway Activity in Gastric Cancer Cell Lines
Five gastric cancer cell lines (AGS, HGC27, HUGC3, GSU, and KE39) that showed varying levels of aneuploidy (Fig. 2A) and one non-neoplastic diploid cell line (RPE1) were evaluated. Levels of pH2AX and pKAP1 were determined in these cell lines to assess intrinsic DNA DSBs/replication stress. In response to DNA damage and replication stress, KAP1 is phosphorylated at serine 473. As expected, RPE1 cells showed minimal staining for pH2AX and pKAP1. Similarly, low levels of pH2AX and pKAP1 were observed in AGS, a TP53 WT gastric cancer cell line displaying the least aneuploidy defects. In contrast, strong and moderate pH2AX and pKAP1 staining in high (KE39 and GSU) and intermediate (HGC27 and NUGC3) aneuploidy cell lines, respectively (Fig. 2B). Importantly, since dsDNA breaks correlate with DDR response, these markers tracked with one another. As such, pH2AX and pKAP1 levels positively correlated with the degree of various ploidy defect measurements and p53 mutation status (Fig. 2C). GSU and KE39 not only demonstrated greater baseline levels of DNA DSB and replication stress compared to RPE1 and AGS measured by pH2AX and pKAP1 but also showed a more dramatic, dose-dependent induction when treated with prexasertib, a well-known Chk1/2 inhibitor (Fig. 2D-2F).
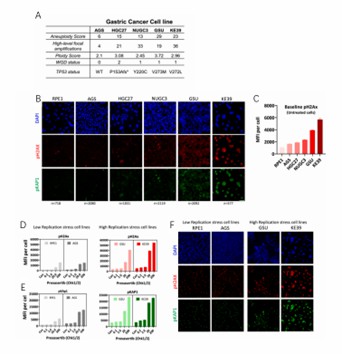 Fig. 2 Aneuploidy correlates with DDR pathway activity in gastric cancer. (Scarpa ES, et al., 2020)
Ask a Question
Write your own review
- You May Also Need
Description: Small cell gastrointestinal carcinoma showing creatine kinase-BB and aromatic L-amino-acid decarboxy. Cell growth is slow.

Description: Human cell line derived from signet ring cell carcinoma of stomach.

Description: Human cell line derived from stomach cancer (gastric cancer; highly differentiated tubular adenocarcinoma).

Description: Human gastric cancer cell line derived from metastasis at liver.
- Adipose Tissue-Derived Stem Cells
- Human Neurons
- Mouse Probe
- Whole Chromosome Painting Probes
- Hepatic Cells
- Renal Cells
- In Vitro ADME Kits
- Tissue Microarray
- Tissue Blocks
- Tissue Sections
- FFPE Cell Pellet
- Probe
- Centromere Probes
- Telomere Probes
- Satellite Enumeration Probes
- Subtelomere Specific Probes
- Bacterial Probes
- ISH/FISH Probes
- Exosome Isolation Kit
- Human Adult Stem Cells
- Mouse Stem Cells
- iPSCs
- Mouse Embryonic Stem Cells
- iPSC Differentiation Kits
- Mesenchymal Stem Cells
- Immortalized Human Cells
- Immortalized Murine Cells
- Cell Immortalization Kit
- Adipose Cells
- Cardiac Cells
- Dermal Cells
- Epidermal Cells
- Peripheral Blood Mononuclear Cells
- Umbilical Cord Cells
- Monkey Primary Cells
- Mouse Primary Cells
- Breast Tumor Cells
- Colorectal Tumor Cells
- Esophageal Tumor Cells
- Lung Tumor Cells
- Leukemia/Lymphoma/Myeloma Cells
- Ovarian Tumor Cells
- Pancreatic Tumor Cells
- Mouse Tumor Cells