
697
Cat.No.: CSC-C0217
Species: Homo sapiens (Human)
Source: Bone Marrow
Morphology: round, single cells and clusters of cells in suspension
Culture Properties: Suspension
- Specification
- Background
- Scientific Data
- Q & A
- Customer Review
- Documents
CSF1PO: 11, 12,
D13S317: 11, 12
D16S539: 11, 12
D5S818: 11, 13
D7S820: 10, 11
THO1: 8, 9
TPOX: 8, 11
vWA: 16, 18
The 697 cell line is classified as a precursor B-cell acute lymphoblastic leukemia (B-ALL) cell line. It exhibits several characteristic features of B-cell leukemia, including the expression of B-cell markers and the presence of genetic abnormalities commonly found in B-ALL cases.
One notable genetic characteristic of the 697 cell line is the expression of certain mRNA molecules, including BCL2, BCL3, and MYC. These genes play essential roles in cell survival, proliferation, and differentiation. BCL2 is involved in regulating apoptosis (programmed cell death), while BCL3 and MYC are associated with cell cycle control and cellular transformation.
Over the years, the 697 cell line has been extensively characterized and used as a model system for studying the biology of B-ALL. It has been employed in various research areas, including investigating the effects of drug treatments, exploring genetic alterations, and studying the signaling pathways involved in leukemia development.
The 697 Cell Line with Early B-Cell Phenotypes
The 697 cell line consisted of medium-sized lymphoid cells with a large nuclear: cytoplasmic ratio. The nucleus was frequently indented and contained a fine chromatin network; nucleoli were not prominent (Fig. 1). Cytochemical studies showed that the 697 cell line was slightly positive for acid phosphatase and PAS, while it was negative for peroxidase and esterases. Vacuoles in the 697 cell line were shown to contain lipids by the oil-red-O stain. Cytogenetic studies demonstrated that the 697 cell line was pseudodiploid with a marker chromosome consisting of a translocation between chromosome 7 and 19: t (7;19) (q11; q13).
Results of immunologic and terminal transferase testing are summarized in Table 1. The 697 cell line was positive for CALLA and for the HLA-DR antigen. Furthermore, the 697 cell line expressed µ heavy chains but not light chains or any other heavy chain classes. Mu chains were easily detected by immunofluorescence in the cytoplasm, while the cell-surface staining for µ chain determinants was distinct but faint. Additional cell markers identified on the 697 cell line were a myeloid-macrophage antigen (MMA), the human natural killer cell antigen (HNK-l), and the transferrin-receptor antigen (T9). Enzymatic assay for TdT revealed 23 U/108 cells for the 697 cell line. The 697 cell line was found to contain the Epstein-Barr virus nuclear and capsid antigens.
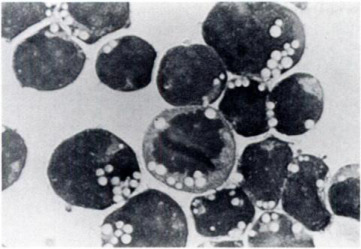 Fig. 1 Photomicrograph of leukemic lymphoblasts from cell line 697 showing prominent vacuolization (× 1000). (Findley HW Jr, et al., 1982)
Table 1. Phenotypic Features of Cell Lines 697. (Findley HW Jr, et al., 1982)
| Surface markers | Common ALL antigen | HLA-DR | IgM heavy chain | IgD, G, A, heavy chains | Kappa, lambda light chains | FcR | CR | E rosettes |
| 70 (60) | 47 (82) | 90 (1) | < 1 (2) | < 1 | 3 (2) | < 1 (0) | < 1 (4) | |
| Surface markers | OKT-3, 4, 5, 8 | OKT-1 | OKT-6 | OKT-9 | Leu-2, 3 | Leu-1 | MMA | HNK-1 |
| < 1 | < 1 | < 1 | 98 | < 1 | < 1 | 81 | 69 | |
| Intracellular markers | IgM heavy chain | IgD, G, A heavy chains | TdT | Kappa, lambda light chains | ||||
| 87 | < 1 | 95 (90) | < 1 |
Bioluminescence Imaging of Leukemia Cell Lines in Vitro and Mouse Xenografts
Although animal models of leukemia often utilize survival time as the primary therapeutic endpoint, bioluminescence imaging (BLI) is increasingly being used to provide a quantitative and more rapid assessment of drug efficacy in pre-clinical oncology research. The utility of bioluminescence imaging (BLI) was investigated using firefly luciferase in monoclonal and polyclonal populations of leukemia cells in vitro and in vivo.
Polyclonal luciferase expressing populations of human T-cell ALL (Jurkat), B-cell ALL (697), and chronic myeloid leukemia (K562) cell lines were generated and luciferase activity was determined by measurement of bioluminescence intensity (photons/second) (Fig. 2). The maximum detectable bioluminescence intensity of the 697 cell line was 4.61 × 10⁶ ± 0.49 photons/second. The signal intensity increased to a maximum after injection of D-luciferin and then decreased slowly over time. The maximum signal intensity was reached between 9 and 16 minutes after the administration of D-luciferin and was also cell-line dependent.
Equal and comparable development of bioluminescence signal was also noted after transplantation of monoclonal populations of luciferase-transduced 697 cell lines in NSG mice (Fig. 3). After transplantation of luciferase-transduced 697 cells, the strongest bioluminescence signal in the liver and the femurs were measured.
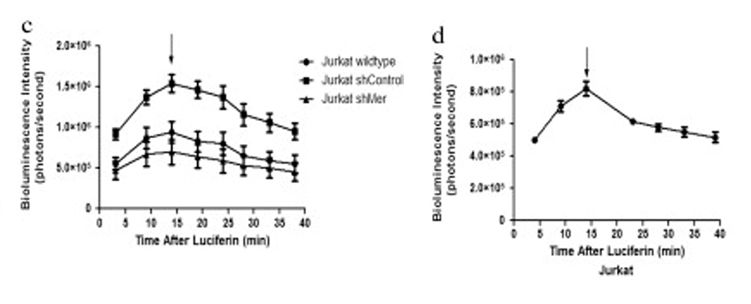 Fig. 2 Dynamic change of the bioluminescent signal in leukemia cell lines (Jurkat, 697 and K562) 8 days post-transduction and Jurkat derivatives 18 days post-transduction. (Christoph S, et al., 2013)
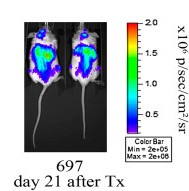 Fig. 3 Pseudocolor images of two representative mice transplanted with monoclonal luciferase-expressing human leukemia cells (697). (Christoph S, et al., 2013)
Ask a Question
Write your own review
- You May Also Need

Description: Established in 2007 from the bone marrow mononuclear cells of an 82-year-old Japanese man with diffuse large B-cell lymphoma in the leukemic phase
Description: Established from the bone marrow of a 28-year-old man who developed the terminal leukemic phase of lymphosarcoma in 1976
Description: This cell line was derived from the bone marrow aspirate of a 59 year old male with erythroleukemia that became acute myelogenous leukaemia.The cells form colonies in soft-agar in the presence of ...

Description: Established from the pleural effusion of a 24-year-old woman with recurrent anaplastic large cell lymphoma (ALCL); cells were described to clonally derive from T-lineage lymphoid cells and to be ...

Description: Established from a 37-year-old man at second (refractory/terminal) relapse of Hodgkin lymphoma (nodular sclerosing -> lymphocyte depleted/stage IIISA -> stage IV) after both combined chemo- and ...
Description: Established from the peripheral blood of a 10-year-old Caucasian boy with acute lymphoblastic leukemia (pre B-ALL) at diagnosis in 1993
- Adipose Tissue-Derived Stem Cells
- Human Neurons
- Mouse Probe
- Whole Chromosome Painting Probes
- Hepatic Cells
- Renal Cells
- In Vitro ADME Kits
- Tissue Microarray
- Tissue Blocks
- Tissue Sections
- FFPE Cell Pellet
- Probe
- Centromere Probes
- Telomere Probes
- Satellite Enumeration Probes
- Subtelomere Specific Probes
- Bacterial Probes
- ISH/FISH Probes
- Exosome Isolation Kit
- Human Adult Stem Cells
- Mouse Stem Cells
- iPSCs
- Mouse Embryonic Stem Cells
- iPSC Differentiation Kits
- Mesenchymal Stem Cells
- Immortalized Human Cells
- Immortalized Murine Cells
- Cell Immortalization Kit
- Adipose Cells
- Cardiac Cells
- Dermal Cells
- Epidermal Cells
- Peripheral Blood Mononuclear Cells
- Umbilical Cord Cells
- Monkey Primary Cells
- Mouse Primary Cells
- Breast Tumor Cells
- Colorectal Tumor Cells
- Esophageal Tumor Cells
- Lung Tumor Cells
- Leukemia/Lymphoma/Myeloma Cells
- Ovarian Tumor Cells
- Pancreatic Tumor Cells
- Mouse Tumor Cells