
Primary Human Retinal Pericyte Cells
Cat.No.: CSC-C4360X
Species: Human
Source: Retina; Eye
Cell Type: Pericyte
- Specification
- Background
- Scientific Data
- Q & A
- Customer Review
Primary Human Retinal Pericyte Cells (HRPCs) are mural cells that cover the retinal capillaries. They are involved in the regulation of capillary tone, angiogenesis, blood-retinal barrier (BRB) function and maintenance of vascular stability. Isolated from human retinal microvasculature, these cells exhibit a characteristic stellate morphology with multiple cytoplasmic processes that make direct contact with endothelial cells. HRPCs express PDGFR-β, NG2 proteoglycan and α-SMA markers while they do not show any endothelial (CD31) or glial (GFAP) markers.
Functionally, HRPCs regulate capillary tone through contractile properties, modulate endothelial cell proliferation via PDGF-B/PDGFR-β signaling, and contribute to BRB integrity. The cell dysfunction and pericyte loss leads to diabetic retinopathy (DR), which is induced by chronic hyperglycemia and causes microaneurysms and vascular leakage. HRPCs also play a role in inflammatory responses in the retina by producing cytokines, such as IL-6 and MCP-1. Primary HRPCs have been used in studies related to microvascular disorders, drug development for DR, as well as in assays related to vascular stability. They are often co-cultured with endothelial cells to reconstruct the retinal vasculature in vitro.
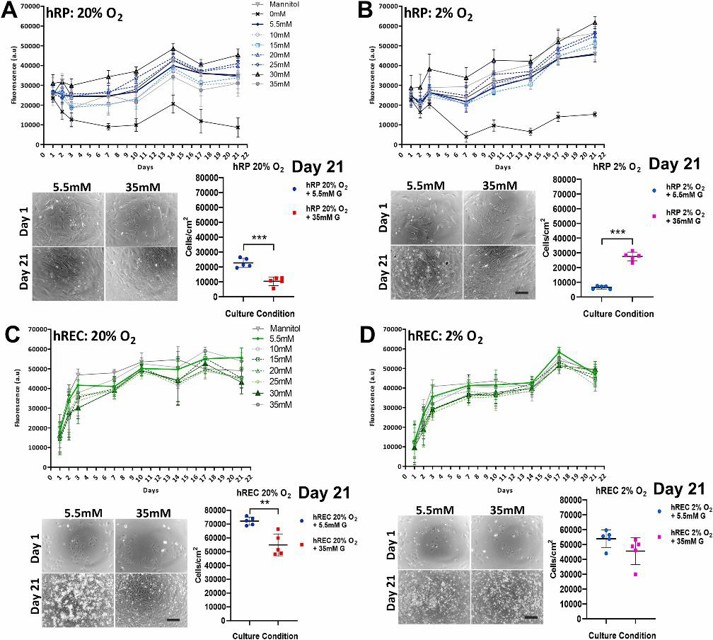
Human Retinal Microvascular Endothelial Cells and Human Retinal Pericyte Cells were Viable in Sustained Hyperglycaemia and Hypoxia
Diabetic retinopathy (DR) is often detected late, leading to vision loss. Eyre et al. uses a human primary co-culture model of retinal microvascular endothelial cells and pericytes to investigate cellular changes in DR. Cells were cultured for up to 21 days under normoxic or hypoxic conditions and physiological or high glucose levels.
hREC and hRP were exposed to 5% oxygen (hypoxic stimulus) to induce a hypoxic response. Ang-2 was activated in hREC and SOD-2 was activated in hRP. In the hypoxic response, a 2% oxygen condition was used in place of 20% oxygen in both normoglycemic and high glucose due to the negligible differences observed. hRP cultured in 20% oxygen and high glucose conditions had higher metabolic activity on day 21 compared to cells cultured in high glucose alone (Fig. 1A). In a hypoxic state (2% oxygen), hRP cultured in high glucose had higher metabolic activity than hRP cultured in normoglycemic conditions (Fig. 1B). hREC cultured in 20% oxygen and high glucose had lower metabolic activity compared to cells cultured in normoglycemic conditions (Fig. 1C). In 2% oxygen, no differences in hREC metabolic activity or cell number were observed between normoglycemic and very high glucose conditions (Fig. 1D). No significant differences were observed between normoglycemic and osmotic control conditions by day 21.
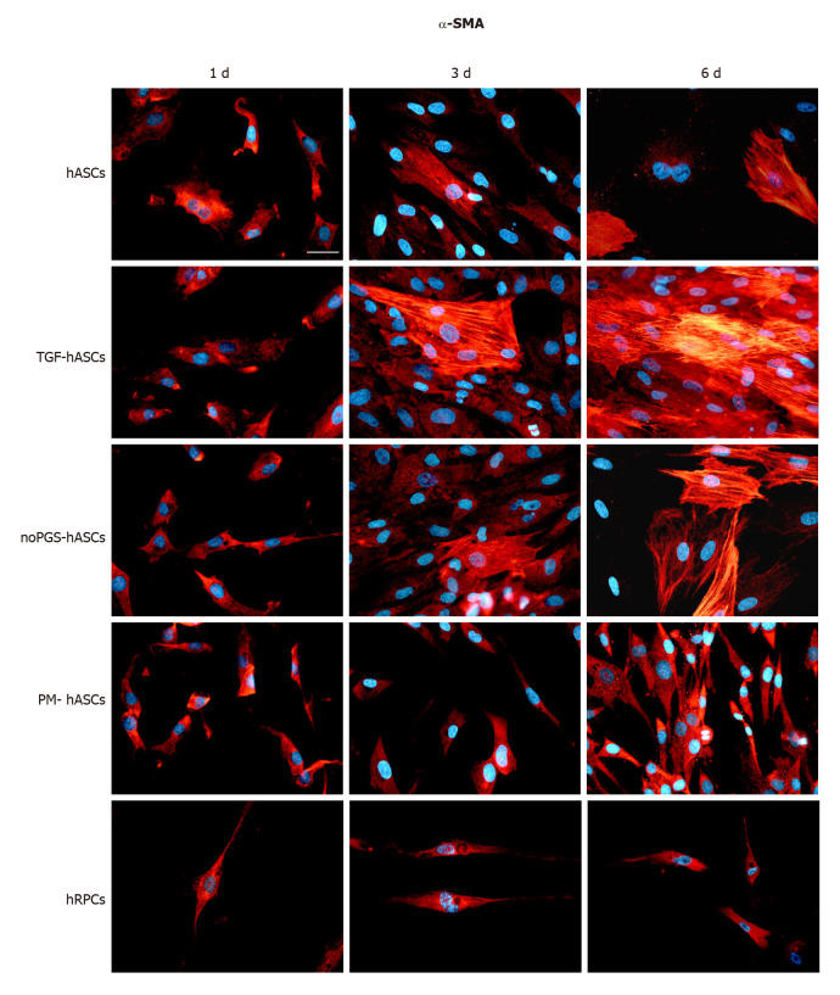
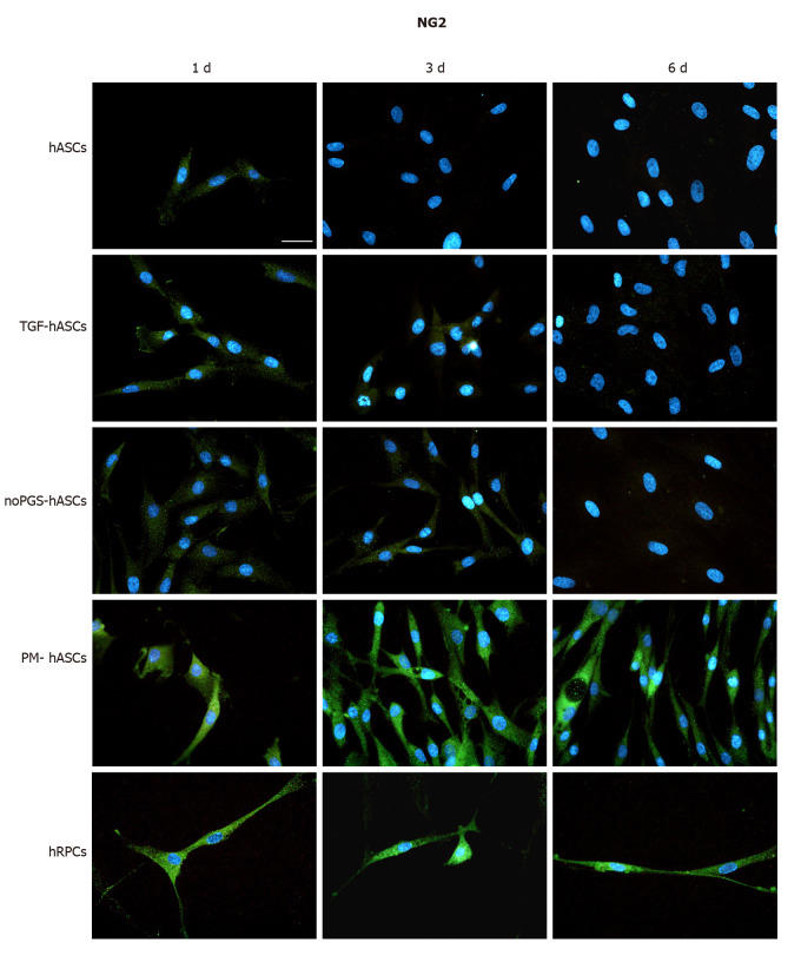
hASC Differentiation into Pericyte-Like Cells
Adipose-derived mesenchymal stem cells (ASCs) can differentiate into various cell types. Pericytes are crucial for stabilizing blood vessels, and their loss, as seen in diabetic retinopathy, leads to blood-retina barrier (BRB) breakdown. Mannino et al. aim to explore in vitro strategies to differentiate human ASCs into pericyte-like cells to restore BRB integrity.
To identify the capacity of hASCs to differentiate into pericyte-like cells, we determined the expression of cell lineage markers α-SMA (Fig. 2) and NG2 (Fig. 3) by immunopositivity. Immunostaining was performed at 1, 3, and 6 days in culture in four hASC groups (hASCs, TGF-hASCs, noPGS-hASCs, and PM-hASCs) and native pericytes (hRPCs). In the hRPCs and all hASC groups, only basal expression of α-SMA could be detected at day 1 (Fig. 2, left column). At day 3 and day 6, the expression of α-SMA was higher in the control hASCs, TGF-hASCs and noPGS-hASCs and appeared filamentous (Fig. 2, middle and right columns). On the other hand, the expression of α-SMA did not change in hRPCs and PM-hASCs during the whole time course (Fig. 2, last two rows). NG2 expression was higher in hRPCs at all time points (Fig. 3, last row) and in PM-hASCs only, among the hASCs groups (Fig. 3, second-last row), showing weak staining in the other groups and time points.
Ask a Question
Write your own review
Description: Human choroidal endothelial cells are isolated from normal human choroidal tissue. The cells are provided at passage 1 and shipped in frozen vials. These cells have a minimum average population ...
Description: Human Non-Pigment Ciliary Epithelial Cells (HNPCEpiC) from Creative Bioarray are isolated from human ciliary bodies. HNPCEC are cryopreserved at primary culture and delivered frozen. Each vial ...
Description: Human Keratocytes (HK) from Creative Bioarray are isolated from human cornea. HK are cryopreserved at primary culture. Each vial contains >5 x 10^5 cells in 1 ml volume. HK are characterized by their ...

Description: RFP Expressing Human Retinal Microvascular Pericytes (RFP-HRMPs) provided by Creative Bioarray are zeocin-selected from Human Retinal Microvascular Pericytes infected with lentivirus expressing RFP. ...
Description: Human Retinal Pigment Epithelial Cells (HRPEpiC) are isolated from human retina. HRPEpiC are cryopreserved at passage one and delivered frozen. Each vial contains >5 x 10^5 cells in 1 ml volume. ...
Description: Human Conjunctival Fibroblasts (HConF) from Creative Bioarray are isolated from human conjunctiva. HConF are cryopreserved at primary culture and delivered frozen. Each vial contains >5 x 10^5 cells ...