Immortalized Human Bone Marrow Mesenchymal Stromal Cells-hTERT (iMSC3)
Cat.No.: CSC-I9245L
Species: Homo sapiens
Source: Bone marrow
Morphology: Spindle-shaped
Culture Properties: Adherent
- Specification
- Background
- Scientific Data
- Q & A
- Customer Review
Note: Never can cells be kept at -20 °C.
2) Surface markers were determined with flow cytometry;
3) Gene expression profile was analysed using the Illumina WG-6 v2 Expression BeadChip and Illumina HumanHT12 v4;
4) Adiopocyte differentiation was detected with Oil Red O staining, while osteoblast differentiation was detected by staining cells with Alizarin Red and ALPL and quantification;
5) DNA methylation profiling was performed using the Illumina HumanMethylation450 BeadChip. Copy number verification was performed with high-resolution mapping using Affymetrix Genome-Wide Human SNP Array 6.0;
6) Karyotype analysis was performed by arresting cells during metaphase and subjecting chromosomes to G-banding and subsequent imaging;
7) Tumorgenicity was verified in vivo with subcutaneous injection into immunodeficient athymic mice;
8) miRNA expression profile was determined using high-throughput sequencing.
The iMSC3 cell line originates from human bone marrow and achieves immortality through the introduction of the telomerase gene (hTERT). Bone marrow functions as a complex tissue within bone central cavities and serves as the main site for hematopoiesis. Bone marrow consists of hematopoietic stem cells (HSCs) with non-hematopoietic cells such as mesenchymal stem cells (MSCs). These MSCs are found in the bone marrow stroma and are closely associated with blood vessels, providing a supportive environment for hematopoietic cells.
iMSC3 cells demonstrate standard mesenchymal stem cell properties which include the ability to differentiate into multiple cell types. Research indicates that these cells transform into adipocytes, chondrocytes, and osteoblasts when subjected to particular inducement protocols. The application of rosiglitazone induces significant adipocyte differentiation in iMSC3 cells which involves the increased expression of brown fat-related genes RBP4 and GDF15. The immortalized nature of the iMSC3 cell line makes it an essential tool for researchers examining mesenchymal stem cell biology alongside differentiation processes and disease-associated molecular regulatory systems.
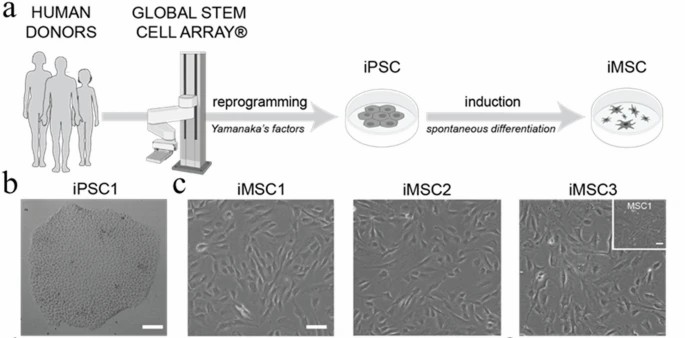 Fig. 1. Derivation and characterization of human iMSC lines (Gultian KA, Gandhi R, et al., 2022).
Transcriptomic Profiling of the Telomerase Transformed Mesenchymal Stromal Cells Derived Adipocytes in Response to Rosiglitazone
The escalating obesity epidemic calls for novel therapeutic interventions as current methods fall short of resolving excessive adipose accumulation and related health risks. Mesenchymal Stem Cells (MSCs) play a crucial role in obesity by differentiating into adipocytes, elucidating adipogenesis is fundamental for effective intervention. Al-Ali et al. employs mRNA sequencing to analyze transcriptomic profiles of iMSC3-derived adipocytes exposed to rosiglitazone, enriching our understanding of molecular regulations involved in adipogenesis.
The transcript abundance, expressed as Fragment Per Kilobase per Million mapped reads (FPKM) values, reflects gene expression levels calculated from mapped reads. These counts are proportional to gene expression, gene length, and sequencing depth. Using FPKM values, Differentially Expressed Genes (DEGs) were analyzed through DESeq2 for each comparison group. In comparing undifferentiated iMSC3 to fully differentiated adipocytes (A vs B), 1508 genes were differentially expressed-757 downregulated and 751 upregulated, indicating significant transcriptomic changes. Rosiglitazone presence during induction versus absence (C vs B) resulted in 86 DEGs (65 downregulated, 21 upregulated). Between only induction and both induction/maintenance with rosiglitazone (C vs D), 214 genes differed (64 downregulated, 150 upregulated). Notably, FABP4 showed significant differential expression between fully treated and untreated adipocytes (D vs B) (Fig. 1A). Volcano plots display DEG distribution (Fig. 1B).
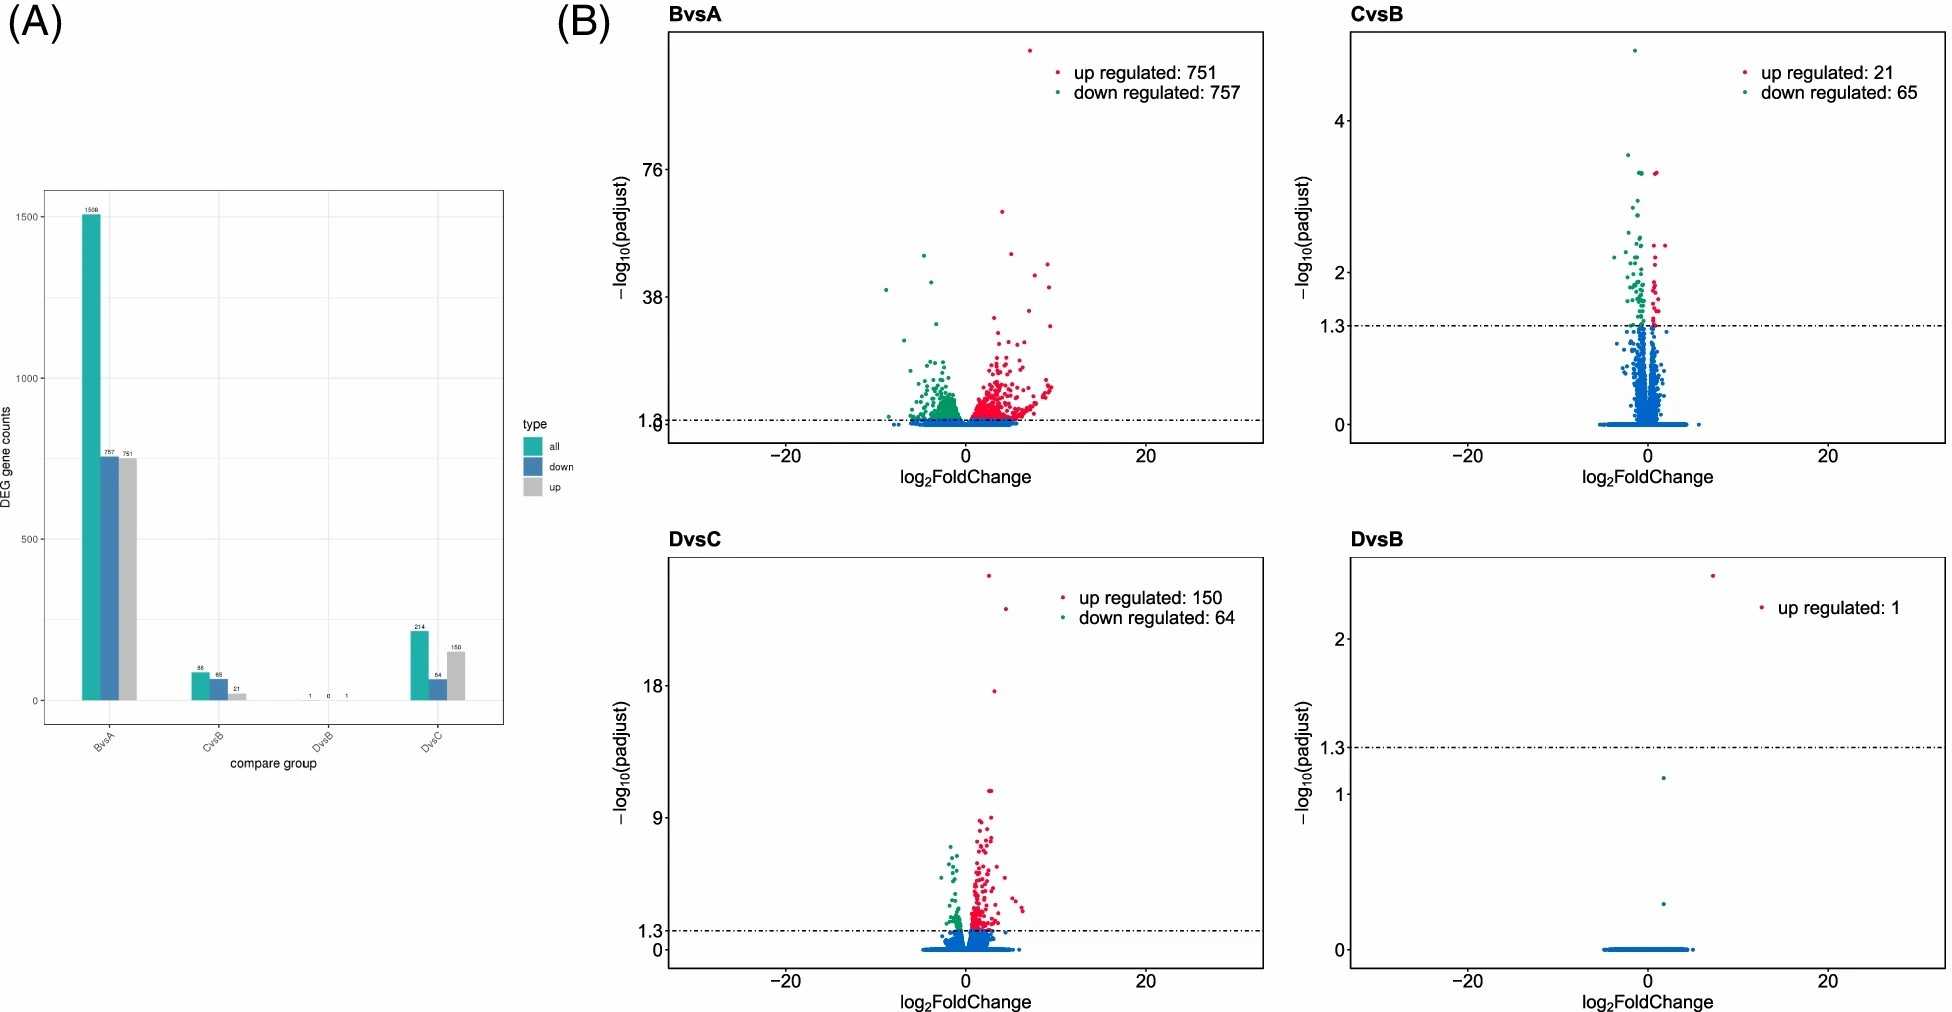 Fig. 1. An overall presentation of differential gene expression analysis data (Al-Ali MM, Khan AA, et al., 2022).
miR-22-3p Decreased Adipocyte Formation and Lipid Content in Differentiated iMSC3
The expansion of adipocytes which drives obesity involves sophisticated signaling pathways such as MAPK and PI3-K while miRNAs like miR-22-3p control these pathways and impact cellular processes including proliferation and differentiation. Alomran et al. used transfection methods to study the impact of miR-22-3p on iMSC3 differentiation into adipocytes by examining changes in lipid content and signaling pathways.
iMSC3 cells develop morphological changes after differentiation into adipocytes through the creation of lipid droplets. Researchers used fluorescent microscopy and inverted light microscopy to examine lipid droplet formation in control samples, non-target miRNA transfected cells and miR-22-3p transfected cells. Oil red and Nile red stains specifically identified fat or lipid droplets while DAPI stained cell nuclei. The control groups (1,2,3,4) displayed greater numbers of larger lipid droplets than the miR-22-3p transfected groups (5,6,7,8) in Figure 2A. Images resulting from the combination of DAPI and Nile red stains demonstrated that lipid droplets surrounded cell nuclei. Transfected cells with miR-22-3p contained fewer lipids when compared to the negative control group. Oil red elution spectrophotometry revealed significantly reduced lipid levels in miR-22-3p cells (p<0.05) when compared to other cells (Fig. 2B). Additionally, average fat droplet numbers (Fig. 2C) were significantly lower (p<0.01, p<0.001) in miR-22-3p transfected cells.
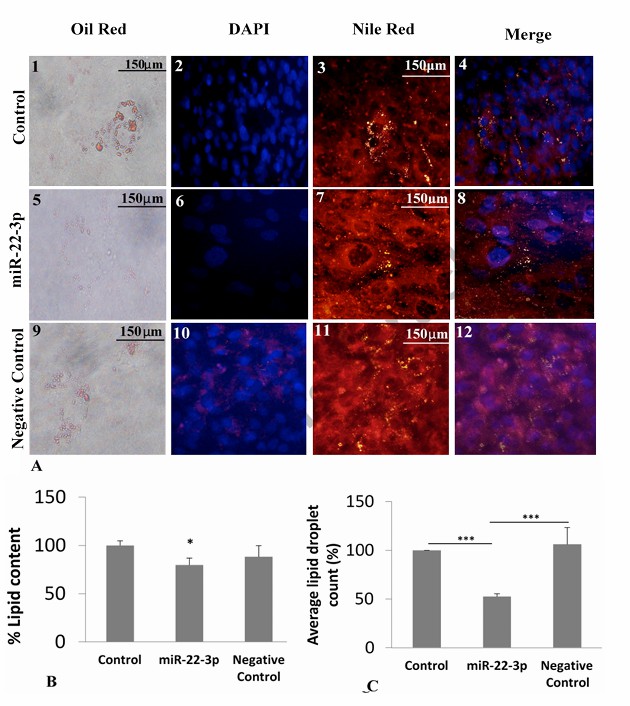 Fig. 2. Morphological effects of miR-22-3p transfection (lipid content and lipid droplet count) on the differentiation of iMSC3 cells into adipocyte (Alomran SS, Khattak MNK, et al., 2021).
Ask a Question
Write your own review
Description: Nasal epithelial cells form the outermost protective layer against environmental factors. They clean, humidify, and warm inhaled air. They produces mucus, which binds particles that are subsequently ...

Description: Immortalized Human Corneal Epithelial Cells-SV40 have been obtained immortalizing Human Corneal Epithelial Cells with Lenti-SV40 Lentivirus. Immortalized cells were controlled passaging side by side ...

Description: Immortalized Human Lymphatic Endothelial Cells-SV40 were developed from human tissues transduced with a lentiviral expression vector containing the SV40T gene. The cell line was continuously cultured ...
Description: Immortalized Human Retinal Pigment Epithelial Cells were isolated from neonatal human globes and spontaneously immortalized in culture bypassing crisis. They retained typical morphology of the ...
- Adipose Tissue-Derived Stem Cells
- Human Neurons
- Mouse Probe
- Whole Chromosome Painting Probes
- Hepatic Cells
- Renal Cells
- In Vitro ADME Kits
- Tissue Microarray
- Tissue Blocks
- Tissue Sections
- FFPE Cell Pellet
- Probe
- Centromere Probes
- Telomere Probes
- Satellite Enumeration Probes
- Subtelomere Specific Probes
- Bacterial Probes
- ISH/FISH Probes
- Exosome Isolation Kit
- Human Adult Stem Cells
- Mouse Stem Cells
- iPSCs
- Mouse Embryonic Stem Cells
- iPSC Differentiation Kits
- Mesenchymal Stem Cells
- Immortalized Human Cells
- Immortalized Murine Cells
- Cell Immortalization Kit
- Adipose Cells
- Cardiac Cells
- Dermal Cells
- Epidermal Cells
- Peripheral Blood Mononuclear Cells
- Umbilical Cord Cells
- Monkey Primary Cells
- Mouse Primary Cells
- Breast Tumor Cells
- Colorectal Tumor Cells
- Esophageal Tumor Cells
- Lung Tumor Cells
- Leukemia/Lymphoma/Myeloma Cells
- Ovarian Tumor Cells
- Pancreatic Tumor Cells
- Mouse Tumor Cells