Immortalized Mouse Cerebral Capillary Endothelial Cells (cEND)
Cat.No.: CSC-I9179L
Species: Mus musculus
Source: Cerebral cortex
Morphology: spindle shaped
Culture Properties: Adherent
- Specification
- Background
- Scientific Data
- Q & A
- Customer Review
Note: Never can cells be kept at -20 °C.
CIK-HT003 HT® Lenti-SV40T Immortalization Kit
2) Tight junction protein Claudin-5 assessed by immunostainning and claudin-1, -3 and -12 detected in mRNA level;
3) BBB marker protein Glut-1 and tight junction-associated protein occludin measured by western blot analysis.
The cell line's response to pro-inflammatory stimuli was measured by 1) TER, 2) western blot and 3) gene expression analysis using RT-PCR.
cEND cell line is an endothelial cell line derived from mouse brain area of capillary area, including cerebral cortex and cerebellar cortex. Brain capillary endothelial cells together with astrocyte end-feet and pericytes and the basement membrane form the blood–brain barrier (BBB) which maintains central nervous system (CNS) microenvironment stability.
Researchers utilize the cEND cell line to examine blood–brain barrier functionality. These cells can form high-resistance tight junctions and have low paracellular permeability and fluid-phase endocytosis, which are similar to primary brain endothelial cells. cEND cells can also express blood–brain barrier markers, such as occludin, and the expression level of which can be increased by the induction of hormones (such as glucocorticoids) to promote the enhancement of the barrier function. Additionally, cEND cells demonstrate immune regulatory functions through the expression of MHC class II antigens and lymphocyte interaction when stimulated by inflammatory factors like TNF-α and IL-6 and cytokines including IFN-γ.
Notch Signaling Regulates Glut1 Expression and Glucose Metabolism in BMECs In Vitro
High-fat diet (HFD)-induced obesity impairs brain glucose uptake and blood-brain barrier (BBB) function. Glut1, a key transporter of brain glucose uptake, is downregulated in brain endothelial cells from obese mice. However, the mechanism for this dysregulation remains poorly understood. In the present study, Zhu et al. examined the hypothesis that Notch signaling mediates HFD-induced changes in BBB permeability, glucose uptake, and insulin signaling.
In situ RNA analysis and ribosomal profiling revealed that short-term HFD feeding downregulated Glut1 and Notch signaling in brain microvascular endothelial cells (BMECs). They next tested if downregulation of Notch signaling was a compensatory response to the reduced glucose transport and glycolysis in BMECs isolated from HFD-fed mice. Immortalized cerebral endothelial (cEND) cells were treated with a Glut1 inhibitor (WZB117) or vehicle and then analyzed by mRNA sequencing. Inhibition of Glut1 did not alter Notch signaling, suggesting that downregulation of Notch signaling is not a secondary response to reduced glucose uptake. They then tested the effect of Notch signaling on Glut1 regulation in cEND cells. Activation of Notch signaling with Dll4 increased glycolysis (Fig. 1A and B). Incubation of cEND cells with serum from HFD-fed mice for 24 h decreased Glut1 protein expression relative to cells incubated in serum from control diet (CD)-fed mice (Fig. 2A and 2B). However, co-incubation with Dll4 rescued Glut1 expression (Fig. 2A and 2B). Similarly, glycolytic capacity and glycolytic reserve were decreased in cEND cells incubated with serum from HFD-fed mice and restored by Notch activation (Fig. 2C and 2D). Together, these results demonstrate that Dll4-mediated Notch activation can rescue the HFD serum-induced inhibition of Glut1 expression and glycolysis in vitro.
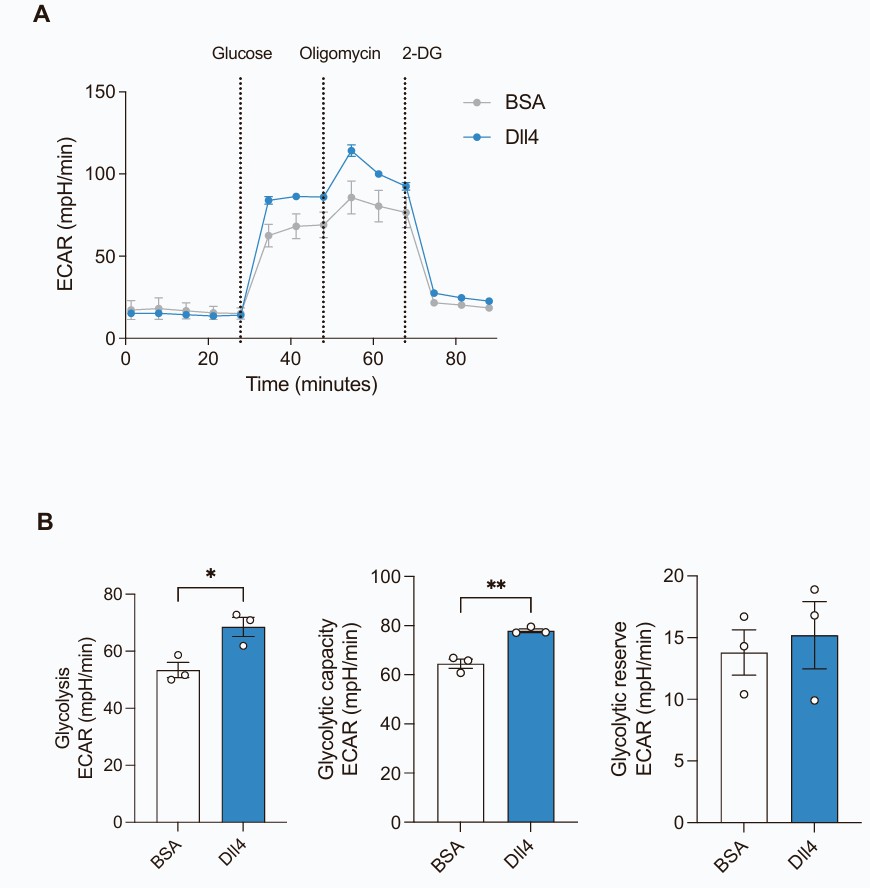 Fig. 1. Notch-activation promotes glycolytic flux in cEND cells (Zhu Y Y, Mehlkop O, et al., 2025).
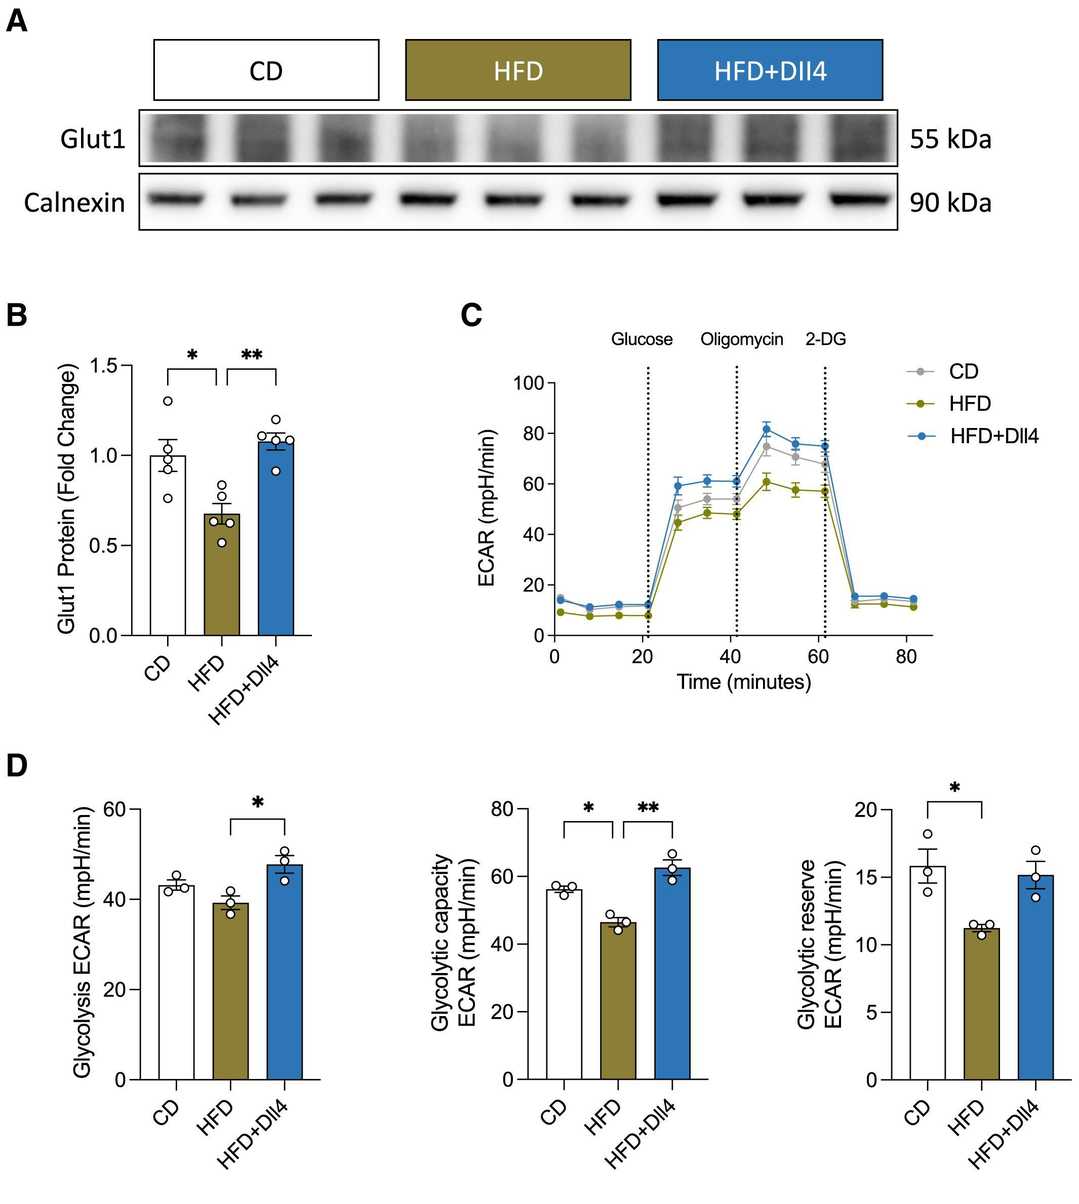 Fig. 2. Notch signaling regulates Glut1 expression in vitro (Zhu Y Y, Mehlkop O, et al., 2025).
Concentration-Dependent Induction of Cld-5 Expression by E2 and DPN
Breast cancer brain metastasis (BCBM) is a devastating and deadly disease that has few treatment options. The blood–brain barrier (BBB) is an effective barrier to circulating metastatic cancer cells and estrogen receptor β (ERβ) has been shown to upregulate tight junction proteins. To gain further insight, Kirchner et al.examined 17β-estradiol (E2) and the selective ERβ agonist diarylpropionitrile (DPN) in endothelial and cancer cells, using Western blot analysis and in vitro BBB models.
To evaluate the impact on claudin-5 (Cld-5), an important estrogen target that is critical to BBB integrity, the authors performed Western Blot on murine (cEND) and human (hCMEC/D3) brain endothelial cells. After 24 h, E2 (10⁻¹⁰ M) increased Cld-5 expression by 1.20 ± 0.12-fold in cEND cells (p = 0.10) (Fig. 3a). Other E2 concentrations (10⁻¹² M, p = 0.89; 10⁻⁸ M, p = 0.28; 10⁻⁶ M, p = 0.50) and DPN concentrations (10⁻¹² M, p = 0.76; 10⁻¹⁰ M, p = 0.87; 10⁻⁸ M, p = 0.66; 10⁻⁶ M, p = 0.82) did not significantly alter Cld-5 expression (Fig. 3a and b). In hCMEC/D3 cells, E2 and DPN treatments showed no significant differences (Fig. 3c and d). However, 10⁻¹² M DPN significantly decreased Cld-5 expression by 0.79 ± 0.11-fold (p = 0.50) (Fig. 3d).
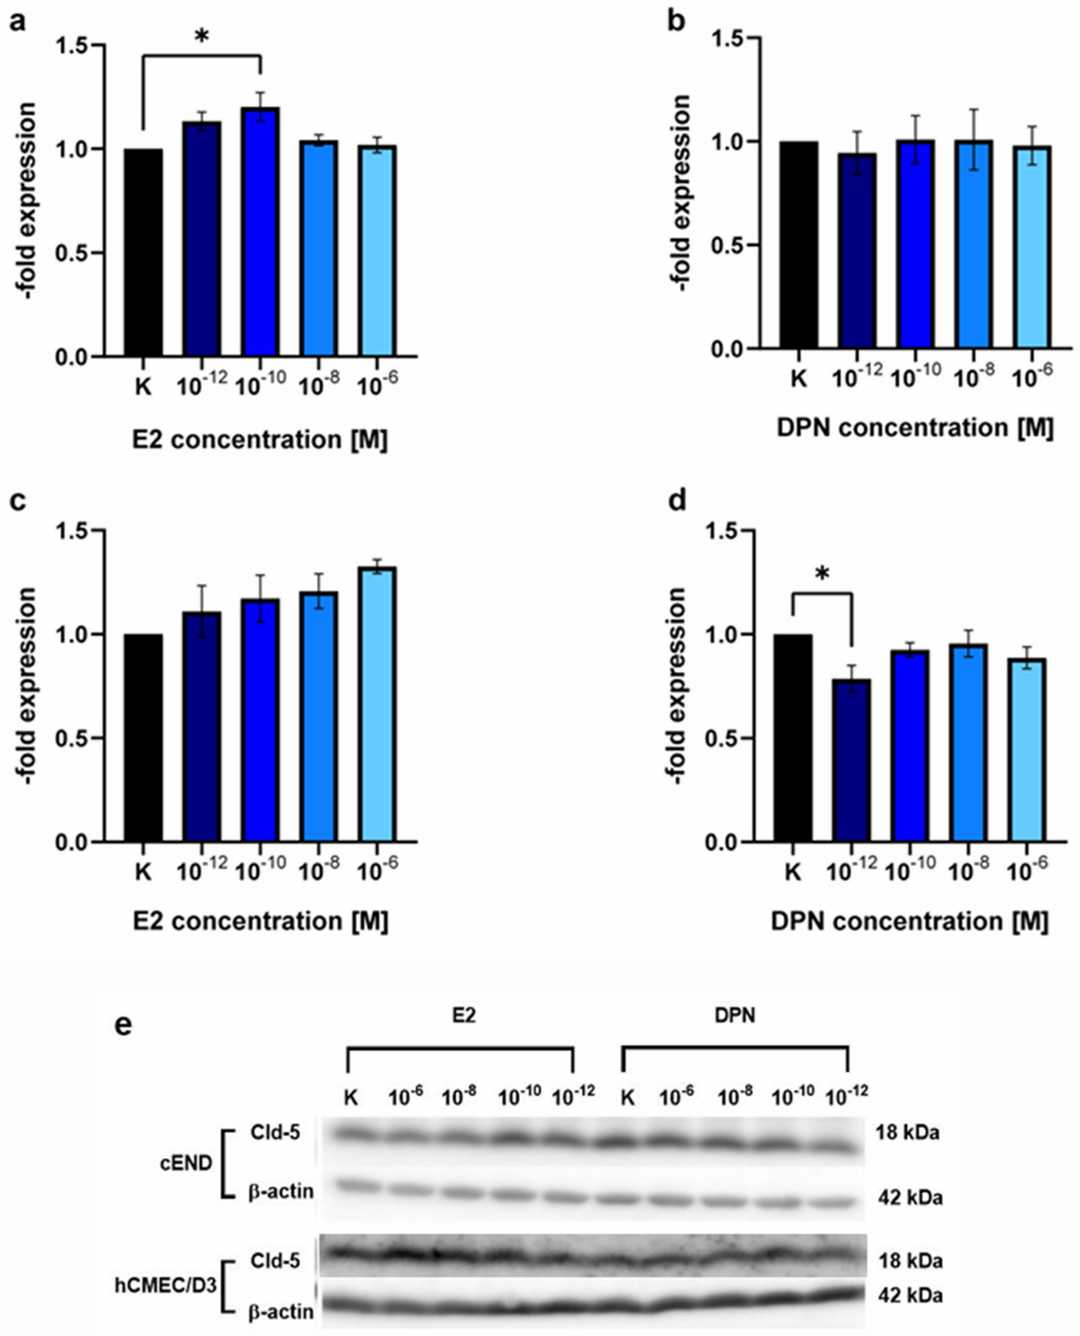 Fig. 3. Western blot analysis showing the concentration-dependent induction of claudin-5 (Cld-5) expression by E2 and DPN. The endothelial cell lines cEND and hCMEC/D3 were analyzed for 24 h in the concentrations 10−12, 10−10, 10−8, and 10−6 M with E2 or DPN (Kirchner J, Völker E, et al., 2024).
Ask a Question
Write your own review
Description: Immortalized Mouse Primary Artery Fibroblasts-GFP provided by Creative Bioarray have been developed by immortalizing mouse artery fibroblasts with SV40 Large T antigen and transfecting with tGFP. The ...
Description: Immortalized MHC II -/- Mouse Macrophage Cells (C2D) is derived from the knockout mice negative for MHCII molecule. They are stable in culture and survived through crisis in which they spontaneously ...
Description: The bone morphogenetic proteins (BMPs) produced by calvarial cells are crucial in osteoblastic differentiation and bone regeneration, however the limited lifespan of primary cells diminishes their ...
Description: The Immortalized Mouse Atrioventricular Cushion Mesenchymal Cells (tsA58-AVM) were derived from atrioventricular (AV) cushions of H-2Kb -tsA58 embryos at E9.5 and were conditionally immortalized in ...
Description: IDG-SW3 represent a non-homogenous population progressing from early osteoblasts to late osteocytic. These cells express functional SV40 large T antigen that is induced in the presence of IFN γ under ...
Description: The Immortalized Mouse Spleen Dendritic Cell (SRDC) line is functionally and phenotypically similar to dendritic cells; specifically, in its antigen presentation, T cell priming, and dendritic cell ...
- Adipose Tissue-Derived Stem Cells
- Human Neurons
- Mouse Probe
- Whole Chromosome Painting Probes
- Hepatic Cells
- Renal Cells
- In Vitro ADME Kits
- Tissue Microarray
- Tissue Blocks
- Tissue Sections
- FFPE Cell Pellet
- Probe
- Centromere Probes
- Telomere Probes
- Satellite Enumeration Probes
- Subtelomere Specific Probes
- Bacterial Probes
- ISH/FISH Probes
- Exosome Isolation Kit
- Human Adult Stem Cells
- Mouse Stem Cells
- iPSCs
- Mouse Embryonic Stem Cells
- iPSC Differentiation Kits
- Mesenchymal Stem Cells
- Immortalized Human Cells
- Immortalized Murine Cells
- Cell Immortalization Kit
- Adipose Cells
- Cardiac Cells
- Dermal Cells
- Epidermal Cells
- Peripheral Blood Mononuclear Cells
- Umbilical Cord Cells
- Monkey Primary Cells
- Mouse Primary Cells
- Breast Tumor Cells
- Colorectal Tumor Cells
- Esophageal Tumor Cells
- Lung Tumor Cells
- Leukemia/Lymphoma/Myeloma Cells
- Ovarian Tumor Cells
- Pancreatic Tumor Cells
- Mouse Tumor Cells