
LNCap-LN3
Cat.No.: CSC-C9479L
Species: Homo sapiens (Human)
Source: Lymph Node Metastasis
Culture Properties: monolayer
- Specification
- Background
- Scientific Data
- Q & A
- Customer Review
Shipping Condition: Room Temperature
LNCaP-LN3 is a subline of LNCaP, which was isolated from a patient with prostate cancer. LNCaP-LN3 cells have an epithelial phenotype in vitro with polygonal or irregular cell shapes, large nuclei with prominent nucleoli, and a copious amount of cytoplasm. LNCaP-LN3 cells were established by orthotopic implantation of LNCaP cells in the prostate of nude mice and then isolated from the tumors. The cells have a high metastatic potential, as they are able to metastasize to other organs through the lymphatic system and the blood. LNCaP-LN3 also overexpresses PSA and has higher VEGF expression than other prostate cancer cell lines, which confers a higher angiogenic potential. LNCaP-LN3 is more sensitive to drugs such as dichloroacetate (DCA). LNCaP-LN3 showed a statistically significant decrease in the lactate/choline, lactate/creatine, and lactate/alanine ratios after DCA treatment.
A Combination of Low-Dose DOC and TRAIL had a Significant Effect on Apoptosis in Prostate Cancer Cells through DR4
Tumor necrosis factor-related apoptosis-inducing ligand (TRAIL) is one of the most likely cancer therapeutic drugs because it selectively kills tumor cells and induces cell death (apoptosis) with little effect on normal cells. Lee et al. assessed if docetaxel (DOC) sensitizes prostate cancer (PCa) cells to TRAIL-induced apoptosis and the mechanism of action.
LNCap-LN3, PC3, and DU 145 prostate cancer (PCa) cell lines were employed to evaluate TRAIL plus DOC treatment at 1, 3, 5, and 10 nmol dosages. Hormone-sensitive LNCap-LN3 cells showed dose-dependent apoptosis with increasing concentrations of DOC (Fig. 1A). Castration-resistant PC3 and DU 145 cells were not affected by various concentrations of DOC (Fig. 1A). In DU 145 cells, a low dose of DOC (2 nmol) with TRAIL (100 ng/mL) drastically induced apoptosis. TRAIL (100 ng/mL) alone did not change cell viability (Fig. 1B). Flow cytometry analyses of cell death showed that the combination of DOC (2 nM) and TRAIL (100 ng/mL) treatment significantly increased the ratio of Annexin V(+)/PI(+) in DU 145 cells (Fig. 1C). To understand why the combination of DOC and TRAIL reduced the cell viability of DU 145 cells, they first investigated the underlying mechanism of TRAIL. TRAIL has DR4 or DR5 in the apoptosis cascade. DR4 was expressed only in hormone-sensitive LNCap-LN3 cells but not in castration-resistant PCa cells, DU 145 and PC3 cells. On the other hand, the level of DR5 was unchanged among all three PCa cell lines (Fig. 1C). EZH2 expression, a biomarker for tumor aggressiveness in PCa, was low in LNCap-LN3 cells but high in PC3 and DU 145 cells. EZH2 was significantly decreased with DOC treatment in a concentration-dependent manner, and DR4 expression gradually increased in DU 145 cells (Fig. 1D). The combination of DOC (2 nmol) and TRAIL (100 ng/mL) remarkably reduced the viability of DU 145 cells, whereas DOC alone did not change the viability of DU 145 cells. After DR4 was blocked with DR4 antagonist antibody, the apoptosis induced by the combination of DOC and TRAIL was rescued (Fig. 1E). This means TRAIL which induces DR4 in response to DOC works via DR4.
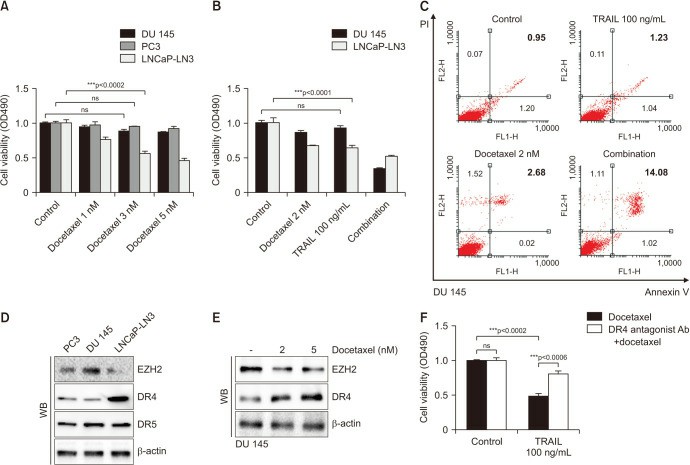 Fig. 1. Cell viability assay in prostate cancer cell lines after docetaxel and TRAIL treatment (Lee W H, Kim S C, et al., 2023).
Deciphering Fatty Acid Synthase Inhibition-Triggered Metabolic Flexibility in Prostate Cancer Cells through Untargeted Metabolomics
FAS, a crucial enzyme in lipid synthesis, is overexpressed in many cancers, including prostate cancer, and its inhibition is a potential therapeutic approach. However, cancer cells' metabolic adaptability reduces the efficacy of FAS inhibitors. To examine how palmitate affects cellular metabolism during FAS inhibition, Oh et al. conducted a metabolomic analysis using UPLC-Orbitrap-MS/MS after exposing LNCaP-LN3 cells to 50 µM of TVB-3166 and palmitate for 24 hours. They analyzed 15 cell extracts (5 biological samples per group: C, D, D + P) and 5 QC samples. In total, 789 and 341 features were detected in positive and negative ion modes, respectively. Principal component analysis (PCA) of the LC-MS/MS data indicated natural clustering among the groups in both ion modes (Fig. 2). Using isotopic palmitic acid-d31, they confirmed palmitate internalization, evident only in the D + P group (Fig. 3). They identified 56 significantly altered polar and nonpolar metabolites—including amino acids, carnitines, phospholipids, and sphingolipids—using various online databases and their in-house database. The heatmap below displays distinctive group features (Fig. 4). The D group, treated with the drug, showed a distinct metabolite profile from the control, while the D + P group, treated with palmitate, had similar profiles to the control C group.
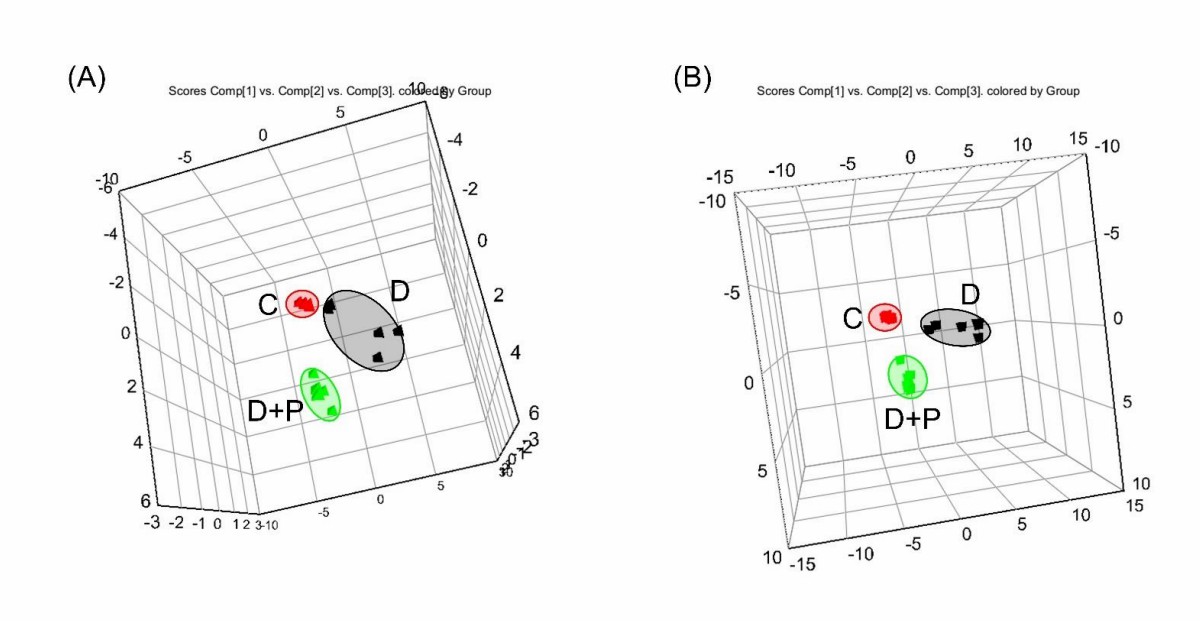 Fig. 2. The 3D score plots of PCA from the metabolomic analysis of treated LNCaP-LN3 cells (Oh E J, Jung B H, et al., 2020).
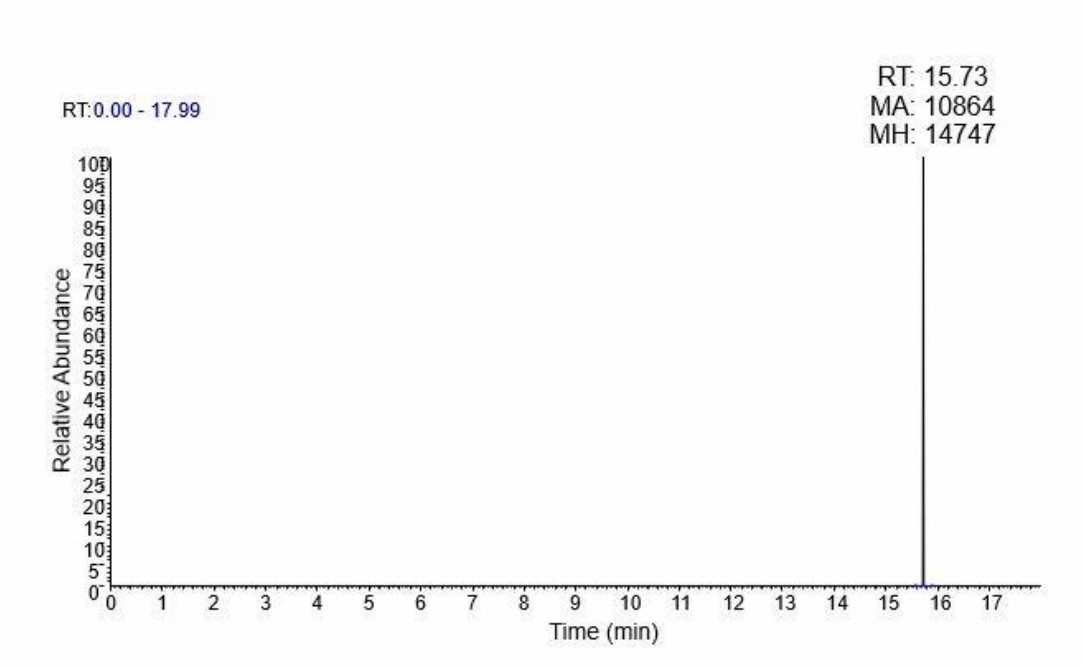 Fig. 3. Palmitic acid-d31 peak in UPLC-Orbitrap MS/MS. Palmitic acid-d31 peaks was observed only in the palmitate treated groups (Oh E J, Jung B H, et al., 2020).
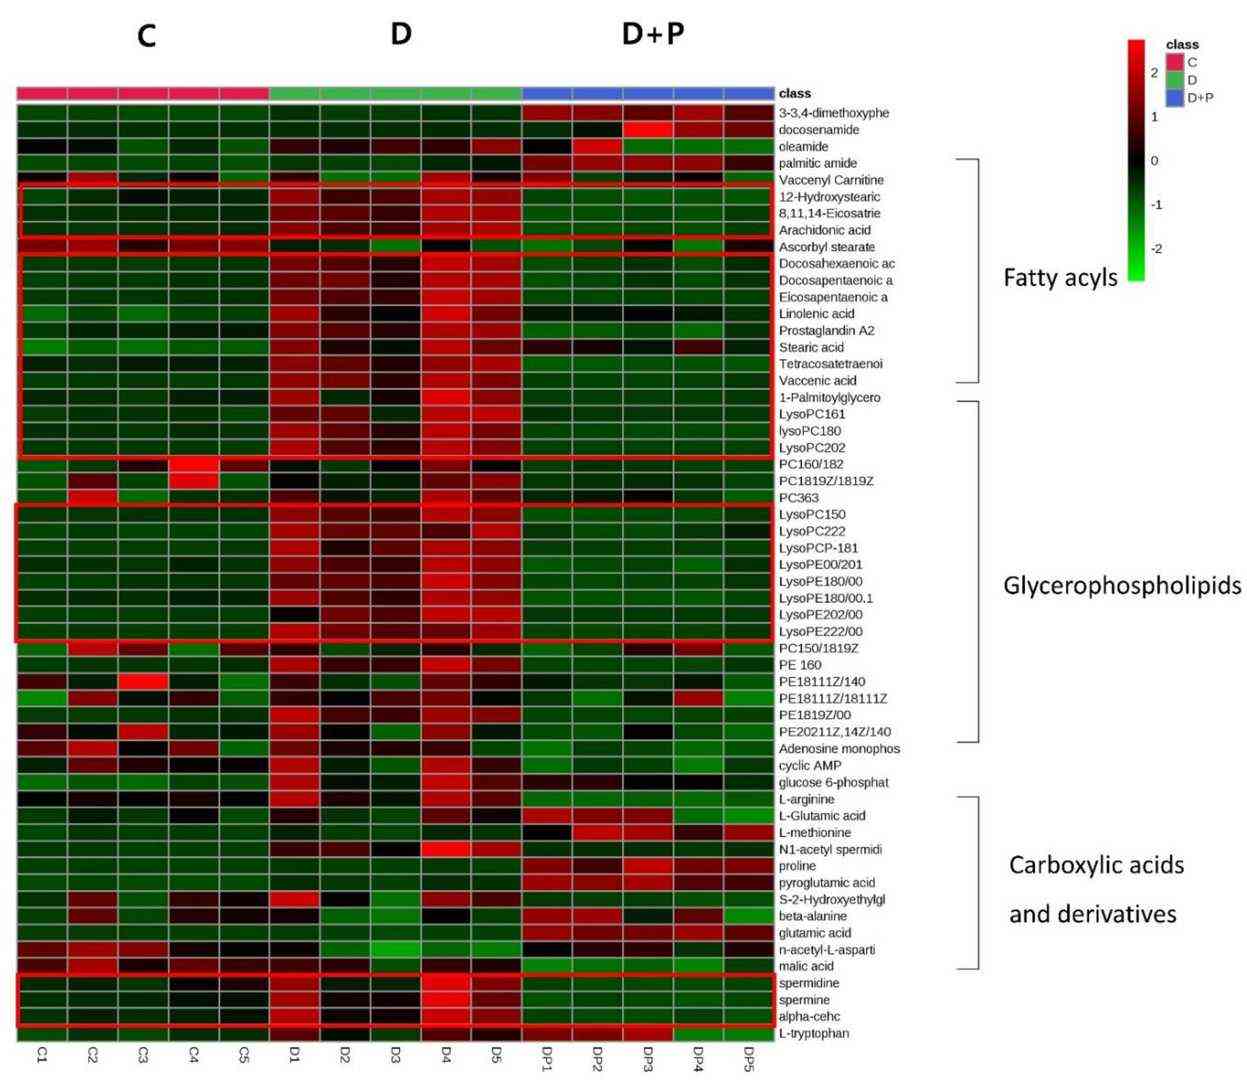 Fig. 4. Hierarchical cluster analysis of identified metabolites. The metabolites were clustered, and shades of green and red represent downregulation or upregulation (Oh E J, Jung B H, et al., 2020).
Ask a Question
Write your own review
- You May Also Need
Description: C4-2 is a cell line with epithelial-like morphology that was isolated from a human prostate cancer LNCaP cell subcutaneous xenograft tumor of castrated mouse.
Description: Cytogenetic analysis and DNA fingerprinting at the Creative Bioarray documented that this cell line is identical with the human prostate carcinoma-derived cell line DU-145, but shows some ...

Description: 22Rv1 is a human prostate carcinoma epithelial cell line derived from a xenograft that was serially propagated in mice after castration-induced regression and relapse of the parental, ...

Description: prostate epithelial cells from a 68-year-old man with benign prostate hyperplasia; cells were immortalized with SV-40 large T-antigen; cells were described to express cytokeratins 8, 18, and 19 (but ...

Description: Derived from a human prostate carcinoma xenograft (CWR22R) that was serially propagated in nude mice after castration-induced regression and relapse of the parental, androgen-dependent CWR22 xenograft
- Adipose Tissue-Derived Stem Cells
- Human Neurons
- Mouse Probe
- Whole Chromosome Painting Probes
- Hepatic Cells
- Renal Cells
- In Vitro ADME Kits
- Tissue Microarray
- Tissue Blocks
- Tissue Sections
- FFPE Cell Pellet
- Probe
- Centromere Probes
- Telomere Probes
- Satellite Enumeration Probes
- Subtelomere Specific Probes
- Bacterial Probes
- ISH/FISH Probes
- Exosome Isolation Kit
- Human Adult Stem Cells
- Mouse Stem Cells
- iPSCs
- Mouse Embryonic Stem Cells
- iPSC Differentiation Kits
- Mesenchymal Stem Cells
- Immortalized Human Cells
- Immortalized Murine Cells
- Cell Immortalization Kit
- Adipose Cells
- Cardiac Cells
- Dermal Cells
- Epidermal Cells
- Peripheral Blood Mononuclear Cells
- Umbilical Cord Cells
- Monkey Primary Cells
- Mouse Primary Cells
- Breast Tumor Cells
- Colorectal Tumor Cells
- Esophageal Tumor Cells
- Lung Tumor Cells
- Leukemia/Lymphoma/Myeloma Cells
- Ovarian Tumor Cells
- Pancreatic Tumor Cells
- Mouse Tumor Cells