SAF-1
Cat.No.: CSC-C9057H
Species: Sparus aurata (Gilthead sea bream)
Source: Fin
Morphology: Fibroblast-like
Culture Properties: Adherent
- Specification
- Background
- Scientific Data
- Q & A
- Customer Review
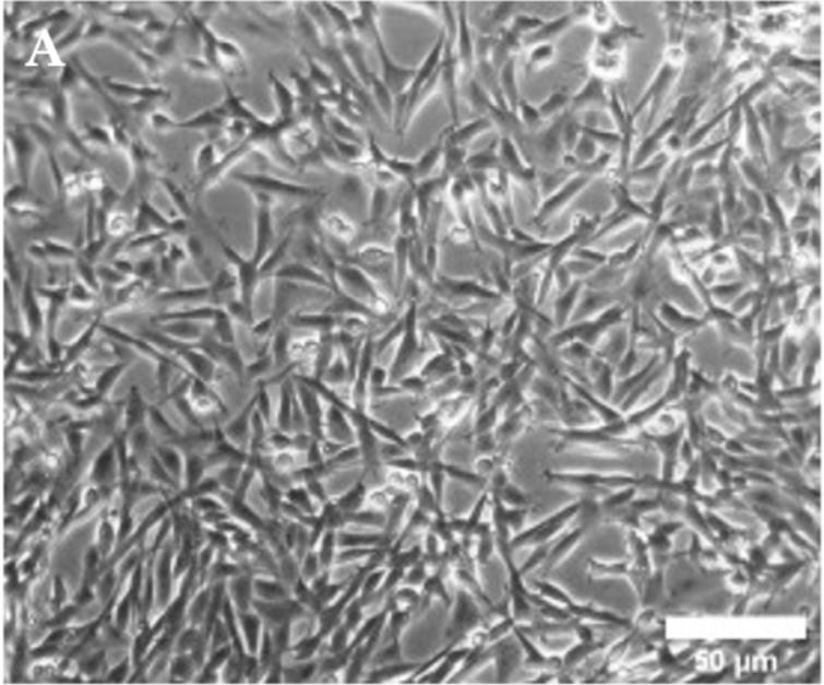
The SAF-1 cell line was derived from the caudal-fin tissue of an adult gilt-head seabream (gilthead seabream, Sparus aurata) and represents a spontaneously immortalised fibroblast-like culture. The cells are adherent, display a fibroblast-type morphology in culture and grow under standard marine fish cell conditions (for example L-15 medium at ~25 °C).
Functionally, SAF-1 has been widely used as an in vitro model for fish virology, toxicology, immunology and cell-biology research. For example, the line supports replication of several fish viruses (including betanodaviruses) and thus serves as a tool for studying pathogen-host interactions, virus susceptibility and viral life-cycle dynamics in marine fish cell systems. In addition, the genetic stability of SAF-1 has been well characterised (telomerase activity, karyotyping, DNA content, microsatellite profiling) which adds confidence in its use as a steady experimental platform. Beyond virology, SAF-1 has been utilised in aquatic toxicology and environmental stress studies-for example to assess heavy-metal induced oxidative stress and cytotoxicity in fish fibroblast-derived cultures. Moreover, the cell line has applicability in fish immunology: it can be used to probe cytokine responses, caspase activities and other cellular pathways relevant to the immune state of marine fish.
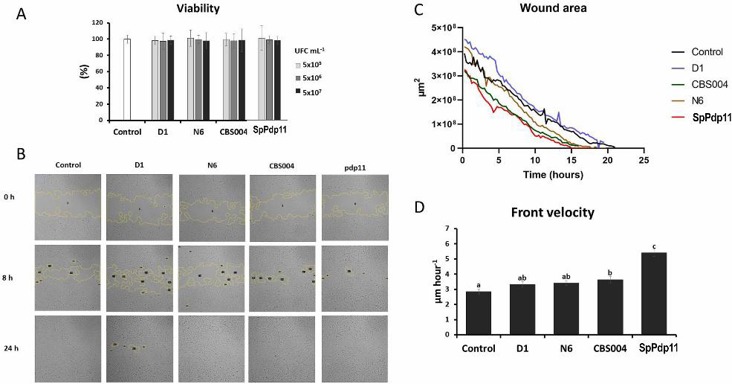
Modulation of Cell Migration and Cell Tracking of the Gilthead Seabream (Sparus Aurata) SAF-1 Cells by Probiotics
Cell migration is essential for immunity and wound healing. Espinosa-Ruíz et al. optimized the in vitro scratch assay for the SAF-1 cell line from gilthead seabream fin. Cells were incubated with three species of extremophilic yeasts and a bacterium, then subjected to scratch and cell tracking assays. The objective was to evaluate the effects of probiotics on cell migration and identify the genetic mechanisms involved.
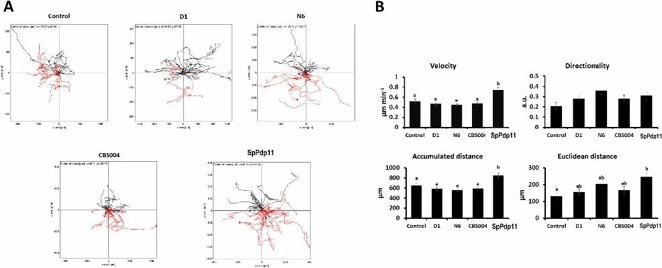
The viability of SAF-1 cells was assessed after 24 h incubation with inactivated probiotics (yeast D1, N6, CBS004, and bacterium SpPdp11). No significant differences (p > 0.05) were found in cell viability at different concentrations (5 × 10⁵, 5 × 10⁶, 5 × 10⁷ CFU/mL) compared to controls (Fig. 1A). A 24-h wound healing assay showed that frontal velocity of SAF-1 cells incubated with CBS004 and SpPdp11 significantly increased (3.63 ± 0.21 and 5.41 ± 0.24 μm/h, respectively) compared to controls. However, no significant differences were observed with D1 and N6 yeasts (Fig. 1C). A cell tracking assay was also performed on SAF-1 cells incubated with probiotics for 24 h (Fig. 2). Cells exposed to yeasts (D1, CBS004, or N6) showed no significant changes in velocity or directionality compared to controls. However, SAF-1 cells incubated with SpPdp11 had increased velocity and significantly higher cumulative and Euclidean distances than controls.
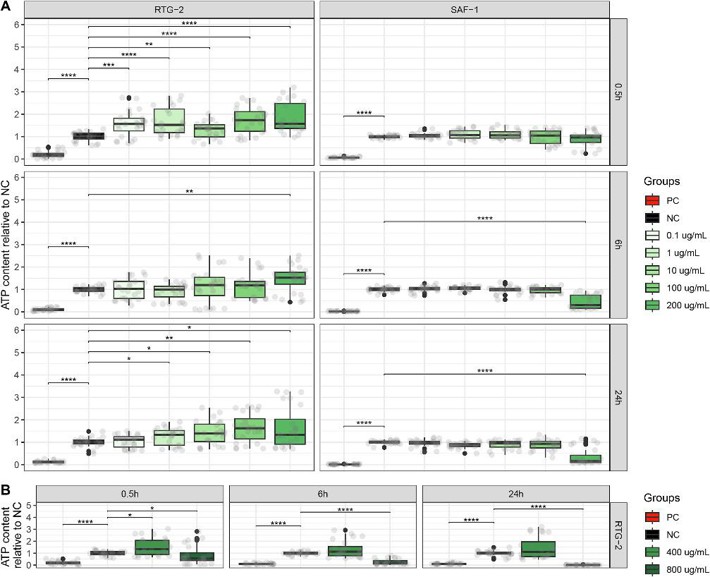
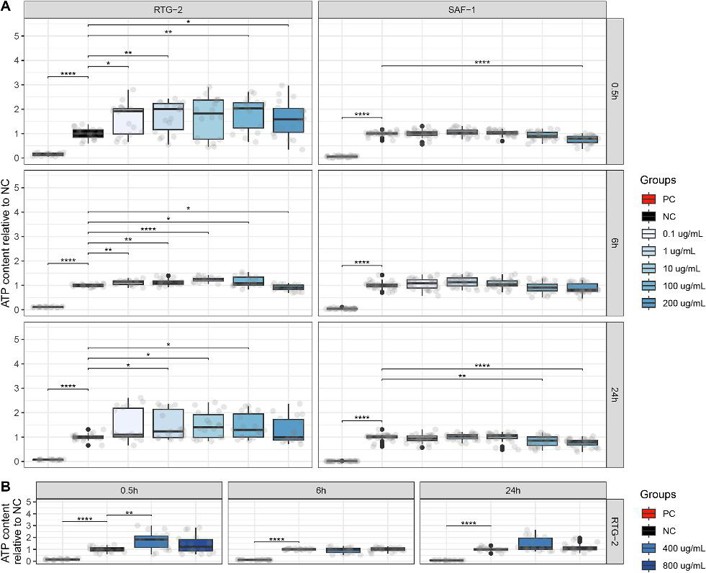
The Impact of PS-NPs on Intracellular ATP Content of Piscine Cell Lines
Nanoplastics contamination in marine and freshwater environments poses a global threat to aquatic life. Given the knowledge gap in polystyrene nanoplastics (PS-NPs) ecotoxicology, this study investigates the harmful effects of 20 nm and 80 nm PS-NPs on the rainbow trout (RTG-2) and gilthead seabream (SAF-1) cell lines. The aim is to understand the cytotoxicity and cellular responses of these cell lines to PS-NPs at different sizes and exposure times.
The cytotoxicity of 20 and 80 nm PS-NPs at increasing doses over 24 hours was evaluated at three time points (0.5, 6, and 24 hours) on RTG-2 and SAF-1 models by monitoring intracellular ATP content (Fig. 3, Fig. 4A-B). At 0.5 hours, 20 nm PS-NPs caused a significant ATP increase in RTG-2 up to 200 μg/mL, with 100 μg/mL resulting in an ATP content of 1.74 ± 0.12 relative to the negative control, while SAF-1 showed no significant changes. At 6 hours, the highest dose of 200 μg/mL caused opposite effects: ATP content in RTG-2 was 1.52 ± 0.12, while in SAF-1 it was 0.31 ± 0.06. At 24 hours, RTG-2 showed a general ATP increase, with a 1.62-fold change at 100 μg/mL, but SAF-1 ATP levels were unaffected up to 100 μg/mL, and 200 μg/mL resulted in the lowest median ATP content of 0.16 ± 0.07 (Fig. 3A). Thus, 200 μg/mL was identified as the lethal dose for SAF-1. To detect cytotoxic doses, RTG-2 were exposed to 400 and 800 μg/mL and evaluated at the same time points: 400 μg/mL caused a slight ATP increase only at 0.5 hours, while the highest dose led to a time-dependent decrease, with the lowest median ATP content of 0.01 ± 0.003 at 24 hours (Fig. 3B). The LC50 at 24 hours was ~478.9 μg/mL for RTG-2 and ~119.0 μg/mL for SAF-1, with significant differences between the cell models. Positive controls (0.5% v/v NaN3) had relative ATP contents of 0.096-0.18 (RTG-2) and 0.013-0.06 (SAF-1).
Ask a Question
Write your own review
- You May Also Need


Description: Derived from tissue posterior to the anus of normal adult minnows. Reported to be capable of growth over a wide temperature range from 4°C-36°C with maximum growth at 34°C. Support growth of the ...
Description: E11 is a clone of the cell line SSN-1 and is persistantly infected with a C-type retrovirus (SnRV). It is susceptible to piscine nodavirus strains belonging to different genotypes (SJNNV, RGNNV, ...

Description: The fish cell line SSN-1 was initiated from whole fry tissue, Channa (Ophicephalus) striatus, commonly named 'striped snakehead'. SSN-1 spontaneously produce and release endogenous snakehead fish ...

Description: From pooled male/female gonad tissue of yearling rainbow trout (Oncorhynchus mykiss). First cell line to be established from cold-blooded vertebrates. 8-fold difference in growth rate in temperature ...

- Adipose Tissue-Derived Stem Cells
- Human Neurons
- Mouse Probe
- Whole Chromosome Painting Probes
- Hepatic Cells
- Renal Cells
- In Vitro ADME Kits
- Tissue Microarray
- Tissue Blocks
- Tissue Sections
- FFPE Cell Pellet
- Probe
- Centromere Probes
- Telomere Probes
- Satellite Enumeration Probes
- Subtelomere Specific Probes
- Bacterial Probes
- ISH/FISH Probes
- Exosome Isolation Kit
- Human Adult Stem Cells
- Mouse Stem Cells
- iPSCs
- Mouse Embryonic Stem Cells
- iPSC Differentiation Kits
- Mesenchymal Stem Cells
- Immortalized Human Cells
- Immortalized Murine Cells
- Cell Immortalization Kit
- Adipose Cells
- Cardiac Cells
- Dermal Cells
- Epidermal Cells
- Peripheral Blood Mononuclear Cells
- Umbilical Cord Cells
- Monkey Primary Cells
- Mouse Primary Cells
- Breast Tumor Cells
- Colorectal Tumor Cells
- Esophageal Tumor Cells
- Lung Tumor Cells
- Leukemia/Lymphoma/Myeloma Cells
- Ovarian Tumor Cells
- Pancreatic Tumor Cells
- Mouse Tumor Cells