
Hepa-E1
Cat.No.: CSC-C9053H
Species: Anguilla japonica (Japanese eel)
Source: Liver
Morphology: Fibroblast-like
Culture Properties: Adherent
- Specification
- Background
- Scientific Data
- Q & A
- Customer Review
The Hepa-E1 cell line was developed from the Japanese eel's (Anguilla japonica) liver tissue which shows characteristics similar to fibroblasts. The Japanese eel stands out as a valuable economic fish species because its liver provides important research insights into metabolic processes and detoxification. These cells lack contact inhibition capabilities and undergo apoptosis when exposed to actinomycin D, humic acid or TGF-β1.
Researchers use Hepa-E1 cells to study how environmental pollutants accumulate biologically and their toxicological effects. For instance, research demonstrates that Hepa-E1 cells show a substantial rise in EROD activity when they interact with contaminated fish extracts which qualifies them as effective biomarkers for detecting organic pollutants in aquatic environments. Hepa-E1 cells are also employed in the study of drug metabolism and toxicity mechanisms. For example, research into androgen receptor (AR) and eel estrogen receptor (eAR) mediated transcriptional activation reveals that Hepa-E1 cells display greater activity levels than other cell lines including CV-1 cells.
n-3 PUFA Synthesis in HEPA-E1, RTH, and CHSE-214 Cells
n-3 LC-PUFA are essential nutrients found in fish oils. Marine fish, the main source of n-3 LC-PUFA, do not produce these fatty acids but accumulate them from primary producers. With increasing demand for fish and seafood, n-3 LC-PUFA sources face limitations due to pollution, overfishing, and global warming. To address this, Nyunoya et al. evaluated the n-3 LC-PUFA synthetic ability of fish cell lines from diverse water habitats using deuterium-labeled PUFA and LC-ESI MS/MS.
They evaluated n-3 LC-PUFA synthesis of cell lines from Japanese eels (HEPA-E1), rainbow trout (RTH), and Chinook salmon (CHSE-214). As shown in Fig. 1a, when d5-18:3n-3 was added to these cell lines, RTH and CHSE-214 cells yielded efficient conversion to d5-20:5n-3, but conversion to d5-22:5n-3 was very low due to weak C20 elongation activity, with no d5-22:6n-3 detected in these two cells. For HEPA-E1 cells, conversion activity to d5-18:4n-3 was very low due to the low ?6 desaturase activity, with d5-22:6n-3 not detected in the cells. HEPA-E1 cells showed entirely weak conversion activities. To address the 22:6n-3 synthesis activity of these cells, d5-20:5n-3 was used and d5-labeled PUFA analyzed. A small amount of d5-22:6n-3 was detected from d5-20:5n-3 in all cells, indicating 22:6n-3 synthesis capability.
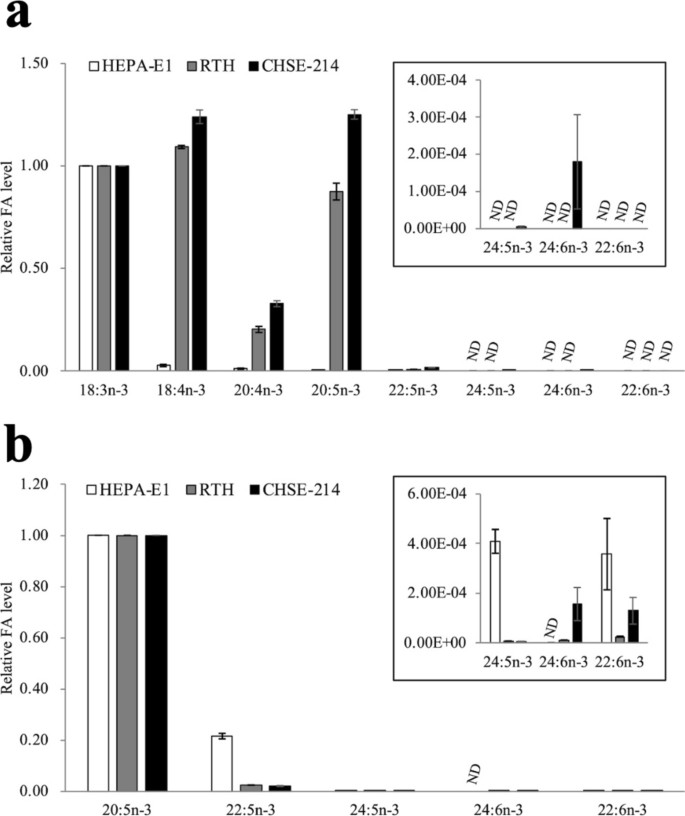 Fig. 1. n-3 LC-PUFA synthetic activity in HEPA-E1, RTH, and CHSE-214 cells (Nyunoya H, Kawagoe R, et al., 2025).
Cellular and Molecular Mechanisms of NiONPs Toxicity on Eel Hepatocytes HEPA-E1
Mining activities lead to high levels of nickel oxide nanoparticles (NiONPs) in the environment, affecting aquatic organisms like eels. Germande et al. investigated the cellular and molecular mechanisms of NiONPs toxicity on Anguilla japonica hepatocytes (HEPA-E1) in vitro.
Hepatocytes were exposed to NiONPs (0.5–5 μg/cm2) for 4 or 24 hours, and endpoints such as viability, oxidative stress, inflammation, calcium signaling, mitochondrial function, and apoptosis were assessed. Results showed that, after internalization, NiONPs mainly clustered in cytoplasmic vesicles (Fig. 2B), unlike controls (Fig. 2A). These NPs usually formed aggregates of various sizes, with single particles rarely seen. NiONPs were also found near the nucleus and mitochondria. qPCR results showed significantly increased expression of caveolin-2 and clathrin-b in treated cells compared to untreated ones (Fig. 2C and D). The WST-1 assay revealed a significant, concentration-dependent decrease in cell viability from 25 μg/cm2 after 24 h of NiONP exposure (Fig. 2E). After 4 h of NiONP exposure, intracellular ROS production decreased significantly in a concentration-dependent manner (Fig. 3A). However, intracellular and mitochondrial O?? production increased significantly (Fig. 3B and C). After 24 h, IL-6 secretion was detected from 2.5 μg/cm2 (Fig. 3D). At the highest NiONP concentration, sodcu/zn, cat, and mt expressions increased significantly (Fig. 3E–G), but SOD activity decreased significantly at all tested concentrations (Fig. 3H).
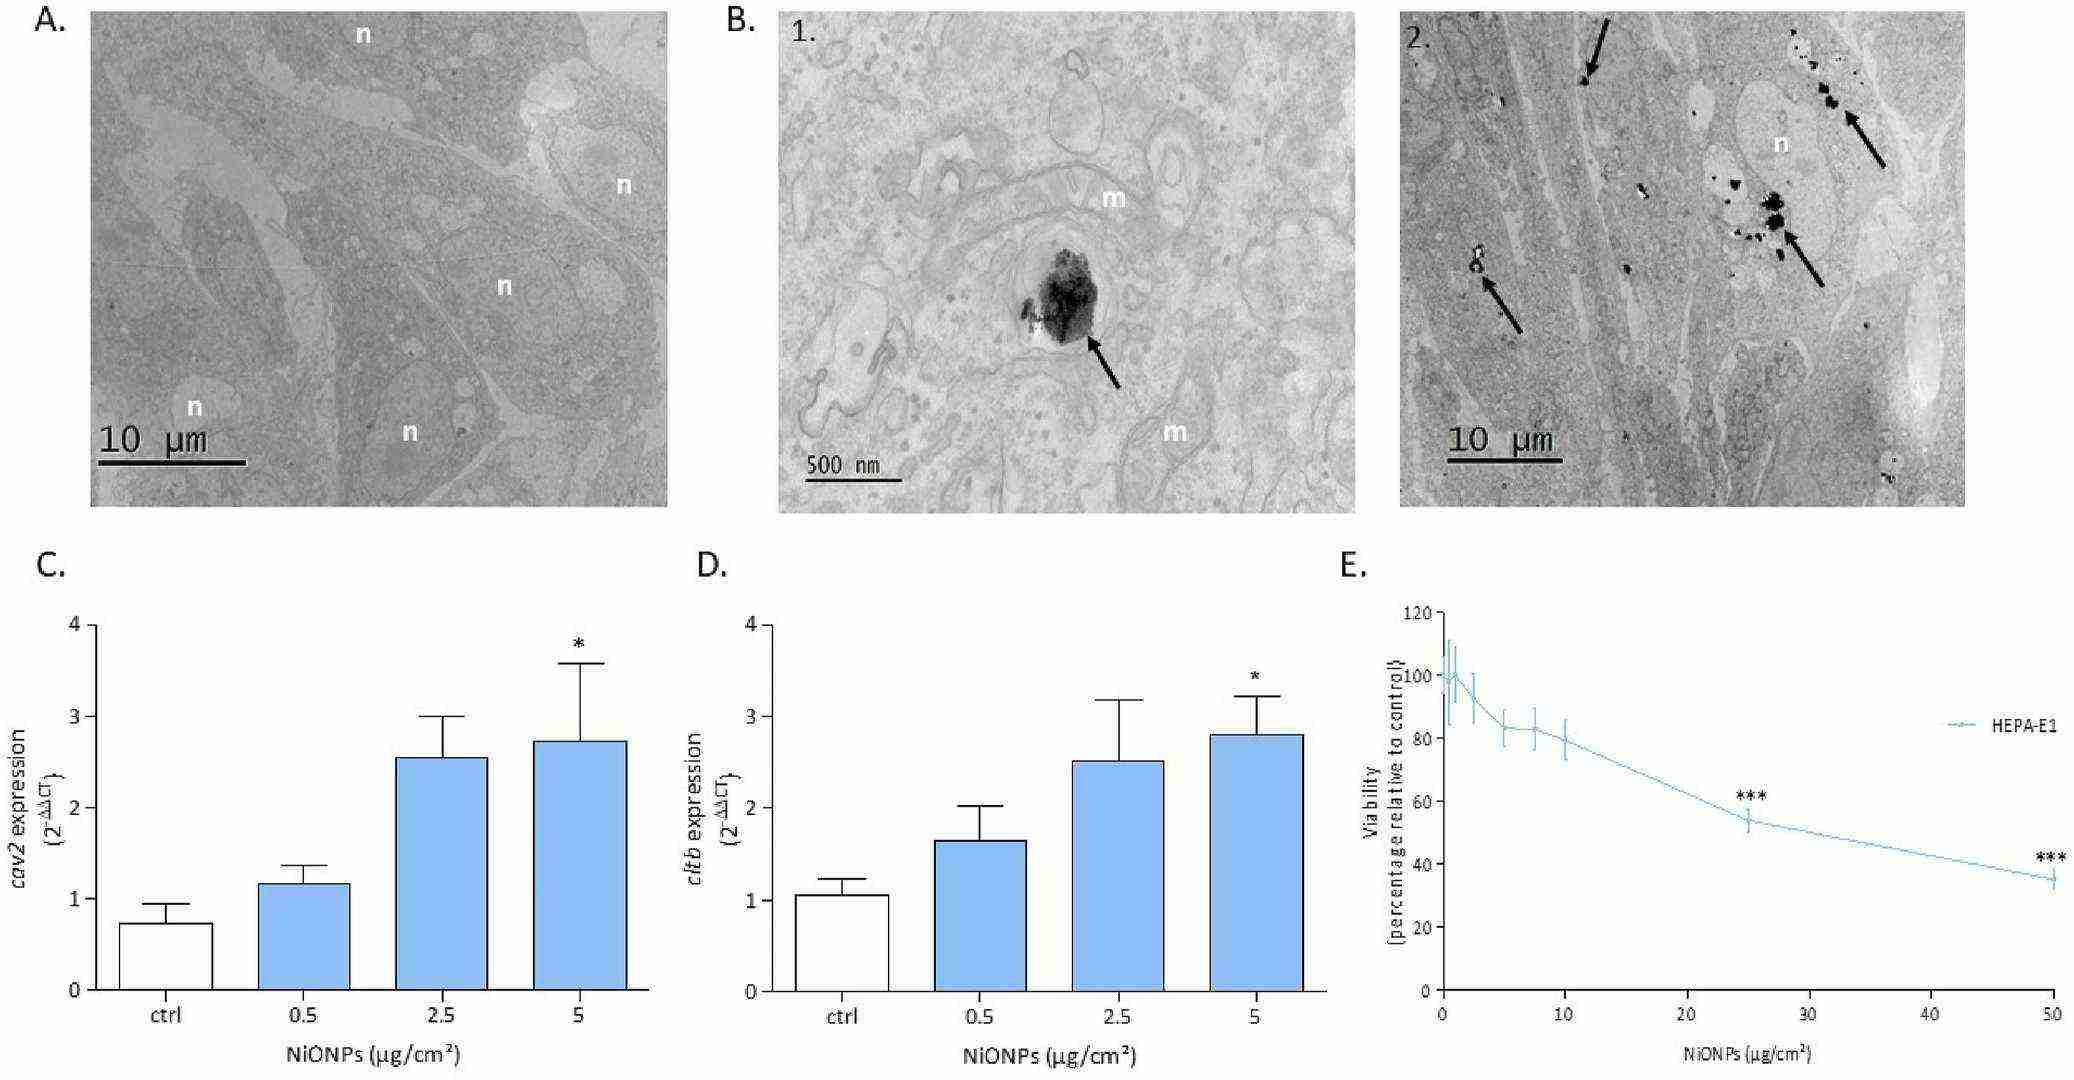 Fig. 2. (A, B) The localization of NiONPs in HEPA-E1 cells via TEM, with aggregates observed near the nucleus and mitochondria. (C-E) The expression of cav2 and cltb mRNA, as well as cell viability after NiONP exposure (Germande O, Beaufils F, et al., 2022).
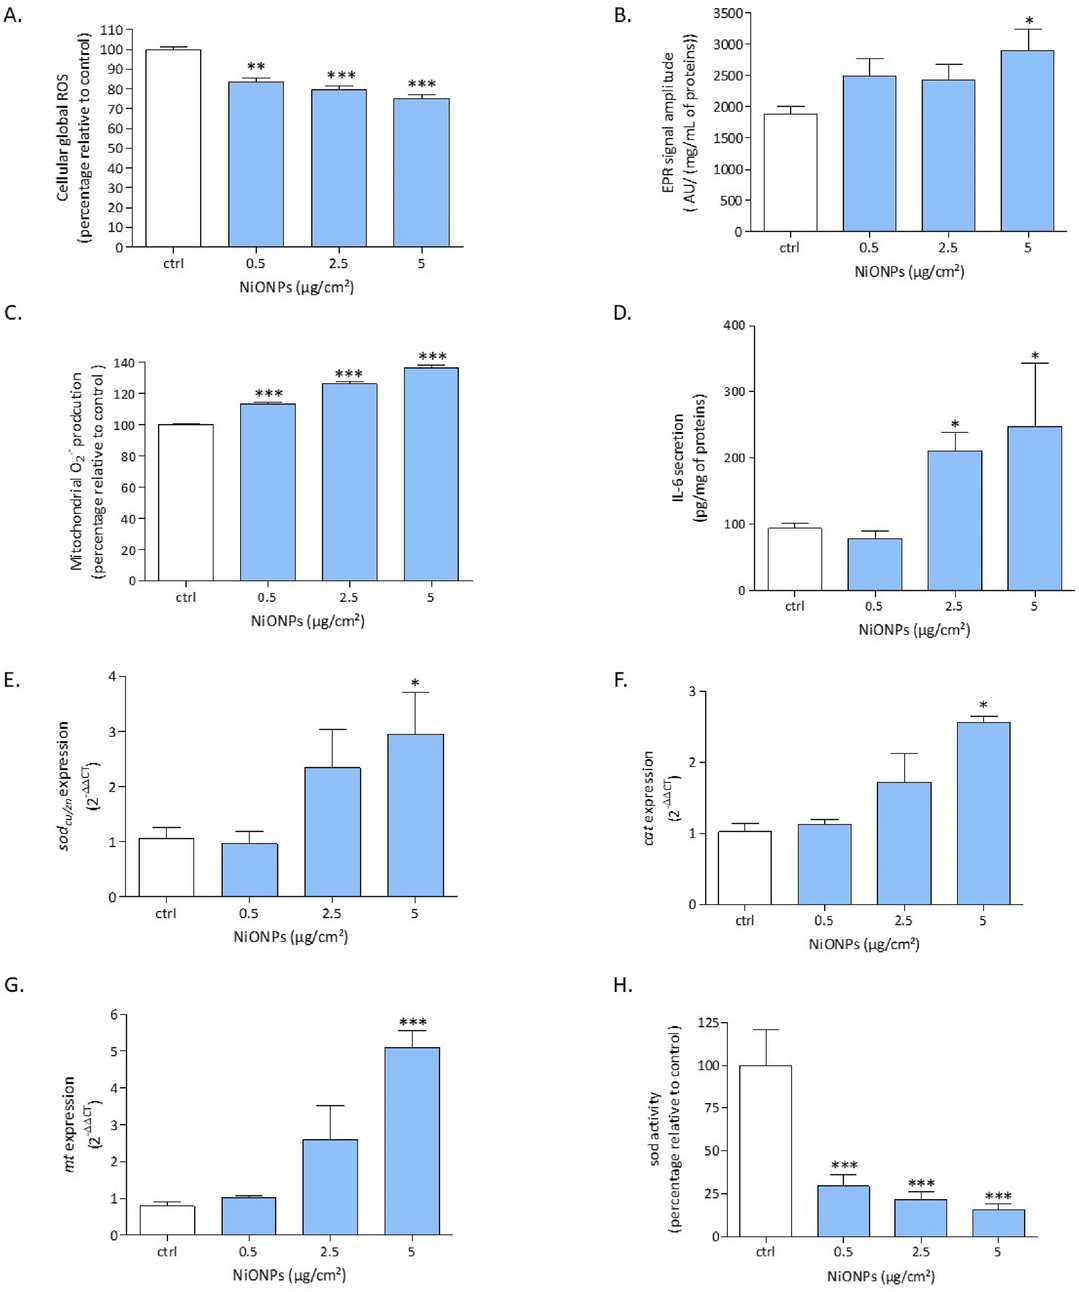 Fig. 3. The effects of NiONPs exposure on HEPA-E1 cells, showing changes in global ROS production, intracellular and mitochondrial O?? production, IL-6 secretion, mRNA expression of sodcu/zn, cat, and mt, as well as SOD activity (Germande O, Beaufils F, et al., 2022).
Ask a Question
Write your own review


Description: Derived from tissue posterior to the anus of normal adult minnows. Reported to be capable of growth over a wide temperature range from 4°C-36°C with maximum growth at 34°C. Support growth of the ...
Description: E11 is a clone of the cell line SSN-1 and is persistantly infected with a C-type retrovirus (SnRV). It is susceptible to piscine nodavirus strains belonging to different genotypes (SJNNV, RGNNV, ...

Description: The fish cell line SSN-1 was initiated from whole fry tissue, Channa (Ophicephalus) striatus, commonly named 'striped snakehead'. SSN-1 spontaneously produce and release endogenous snakehead fish ...

Description: From pooled male/female gonad tissue of yearling rainbow trout (Oncorhynchus mykiss). First cell line to be established from cold-blooded vertebrates. 8-fold difference in growth rate in temperature ...

- Adipose Tissue-Derived Stem Cells
- Human Neurons
- Mouse Probe
- Whole Chromosome Painting Probes
- Hepatic Cells
- Renal Cells
- In Vitro ADME Kits
- Tissue Microarray
- Tissue Blocks
- Tissue Sections
- FFPE Cell Pellet
- Probe
- Centromere Probes
- Telomere Probes
- Satellite Enumeration Probes
- Subtelomere Specific Probes
- Bacterial Probes
- ISH/FISH Probes
- Exosome Isolation Kit
- Human Adult Stem Cells
- Mouse Stem Cells
- iPSCs
- Mouse Embryonic Stem Cells
- iPSC Differentiation Kits
- Mesenchymal Stem Cells
- Immortalized Human Cells
- Immortalized Murine Cells
- Cell Immortalization Kit
- Adipose Cells
- Cardiac Cells
- Dermal Cells
- Epidermal Cells
- Peripheral Blood Mononuclear Cells
- Umbilical Cord Cells
- Monkey Primary Cells
- Mouse Primary Cells
- Breast Tumor Cells
- Colorectal Tumor Cells
- Esophageal Tumor Cells
- Lung Tumor Cells
- Leukemia/Lymphoma/Myeloma Cells
- Ovarian Tumor Cells
- Pancreatic Tumor Cells
- Mouse Tumor Cells