CAR Gene Integration Site Mapping
DNA FISH and G-Banded Karyotype Analysis for In Vivo CAR-T Development
Chromosome-level visualization of CAR transgene integration — a service for early-stage research
In vivo CAR-T is advancing rapidly, and with it a new safety question: where exactly does the CAR gene integrate? Creative Bioarray provides direct, chromosome-level answers by combining DNA FISH with G-banded karyotype analysis. DNA FISH probes reveal the physical location of the CAR transgene on metaphase chromosomes, while G-banding assigns the signal to a defined chromosome and band and screens for structural abnormalities.
With years of hands-on experience in FISH and cytogenetic analysis, Creative Bioarray has supported numerous gene-editing and cell-therapy programs with reliable, high-quality chromosome-level evidence. The service is designed for early-R&D teams developing in vivo CAR-T vectors and site-specific integration strategies.
Service Highlights
- Technique — DNA FISH + G-banded karyotype analysis (metaphase).
- Primary question — where has the CAR transgene integrated — chromosome and band?
- Additional output — screening for translocations, inversions, deletions, and other structural abnormalities.
- Sample types — in vitro engineered T cells and PBMCs, including convenient PBMCs from animal model studies.
- Setting — research and early development only — not for clinical diagnostic use.
In Vivo CAR-T: A New Frontier in Cell Therapy
In vivo CAR-T aims to turn the patient's body into a "CAR factory," replacing the weeks-long ex vivo workflow — leukapheresis, activation, engineering, expansion, reinfusion — with direct in vivo delivery of the CAR gene. Two platforms dominate: engineered lentiviral vectors that selectively transduce T cells, and ligand-targeted lipid nanoparticles (LNPs) delivering CAR-encoding mRNA or DNA. Early clinical data are encouraging, and CRISPR-based strategies are being developed for site-specific CAR integration. But regardless of platform, every integration-competent approach places a foreign gene into the genome of a living cell — knowing precisely where that gene landed is a question every developer must answer.
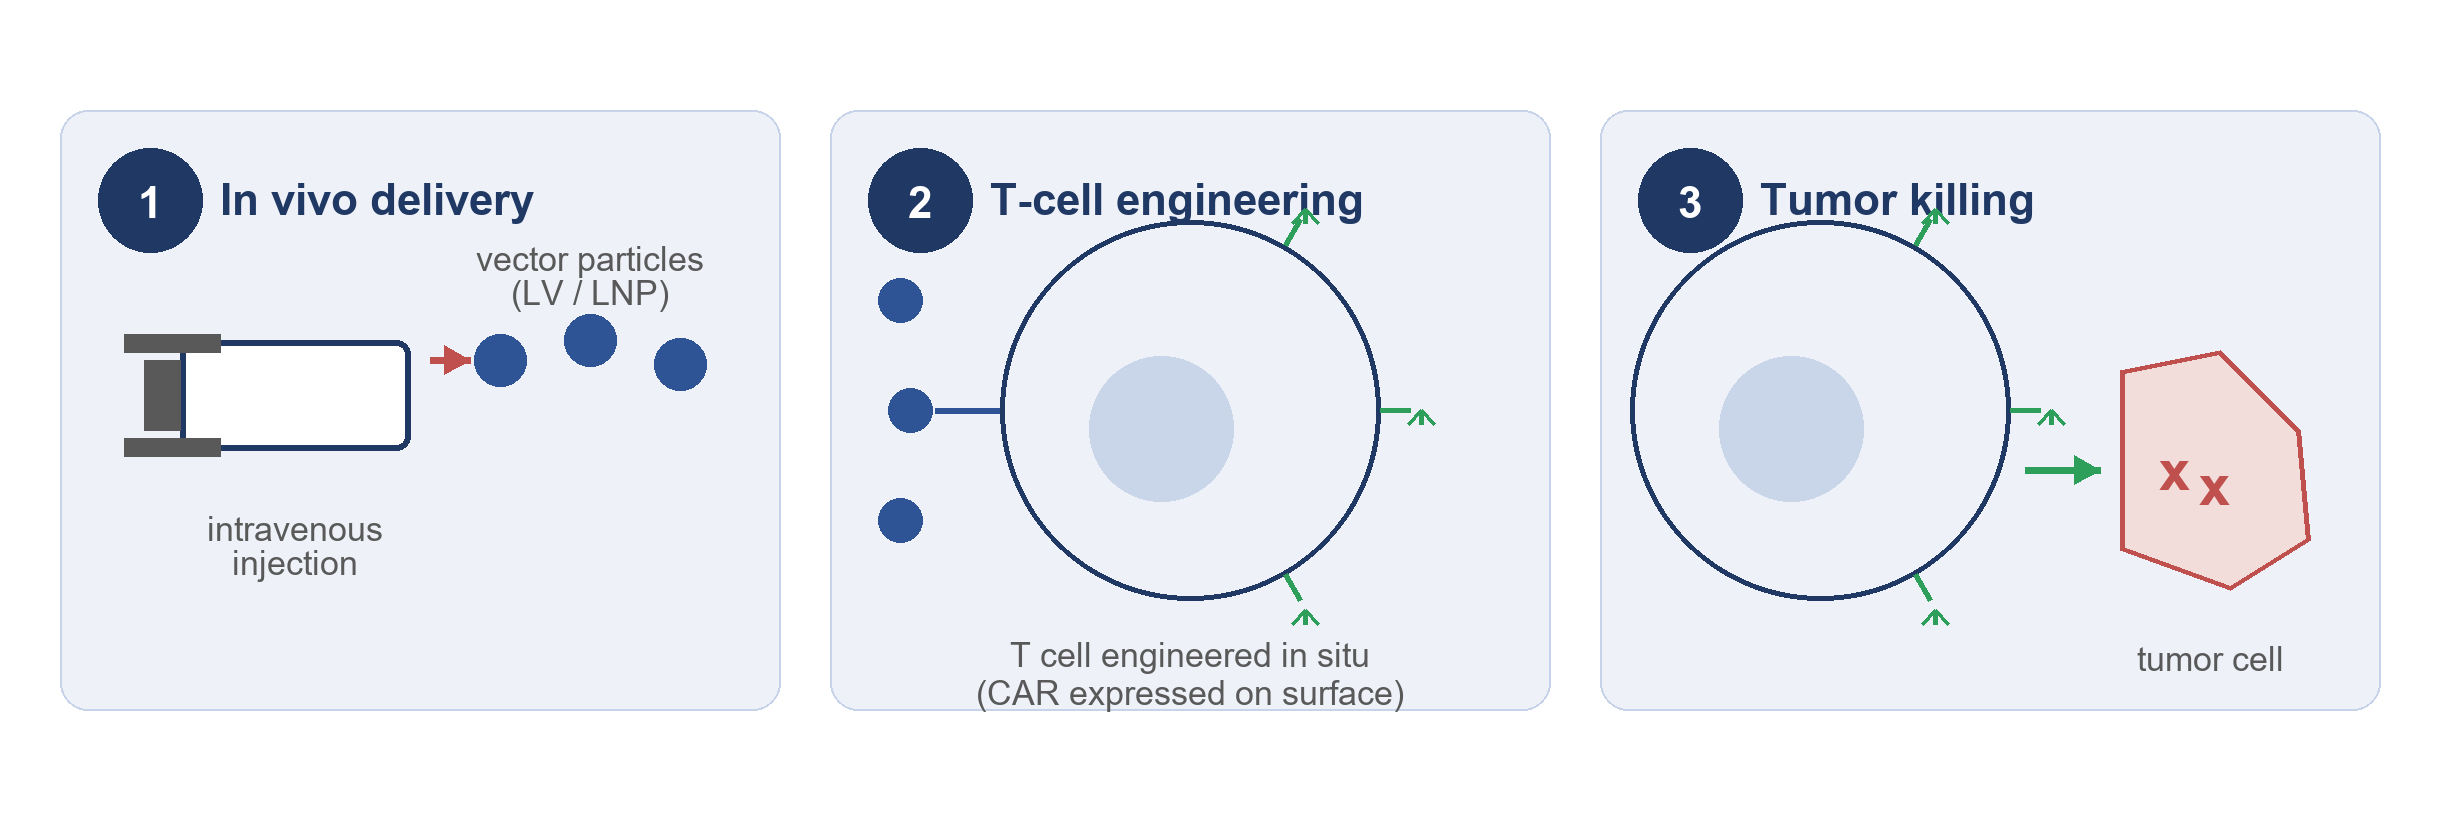 Figure 1. In vivo CAR-T concept: the CAR gene is delivered systemically (1), T cells are engineered in situ (2), and engineered cells recognize and kill tumor cells (3).
The Integration Safety Challenge
Conventional CAR-T relies on viral vectors that integrate semi-randomly, carrying an inherent risk of insertional mutagenesis. The clinical record is sobering: vector-driven activation of LMO2 caused leukemia in early X-SCID trials; in Skysona, over 10% of patients developed hematological malignancies linked to insertions near MECOM and PRDM16; and in April 2024 the FDA issued a class-wide Boxed Warning for CD19- and BCMA-directed CAR-T products citing secondary T-cell cancers. Random integration also threatens function — insertion into heterochromatin can silence CAR expression, and dysregulated expression can drive tonic signaling and T-cell exhaustion. The field's answer is site-specific integration into genomic safe harbors such as TRAC (14q11.2), AAVS1 (19q13.42), and CCR5 (3p21.31). Yet even targeted editing can leave large deletions, translocations, or unintended insertions — so integration must be verified, not assumed.
Our Solution: DNA FISH + G-Banded Karyotype Analysis
DNA FISH uses DNA FISH probes that hybridize to complementary sequences on metaphase chromosomes; the chromosomes; the position of the hybridization signal marks the physical location of the target in the genome. For CAR studies, probes target the CAR coding sequence and vector elements such as WPRE, making every integration event visible. Because the probe targets the transgene rather than a predicted locus, the assay is platform-agnostic — it works for lentiviral, transposon, and CRISPR knock-in approaches alike. G-banding applies Giemsa staining to produce a reproducible banding pattern, allowing FISH signals to be assigned to a specific chromosome and band (e.g., 14q11.2) at 400–550-band resolution.
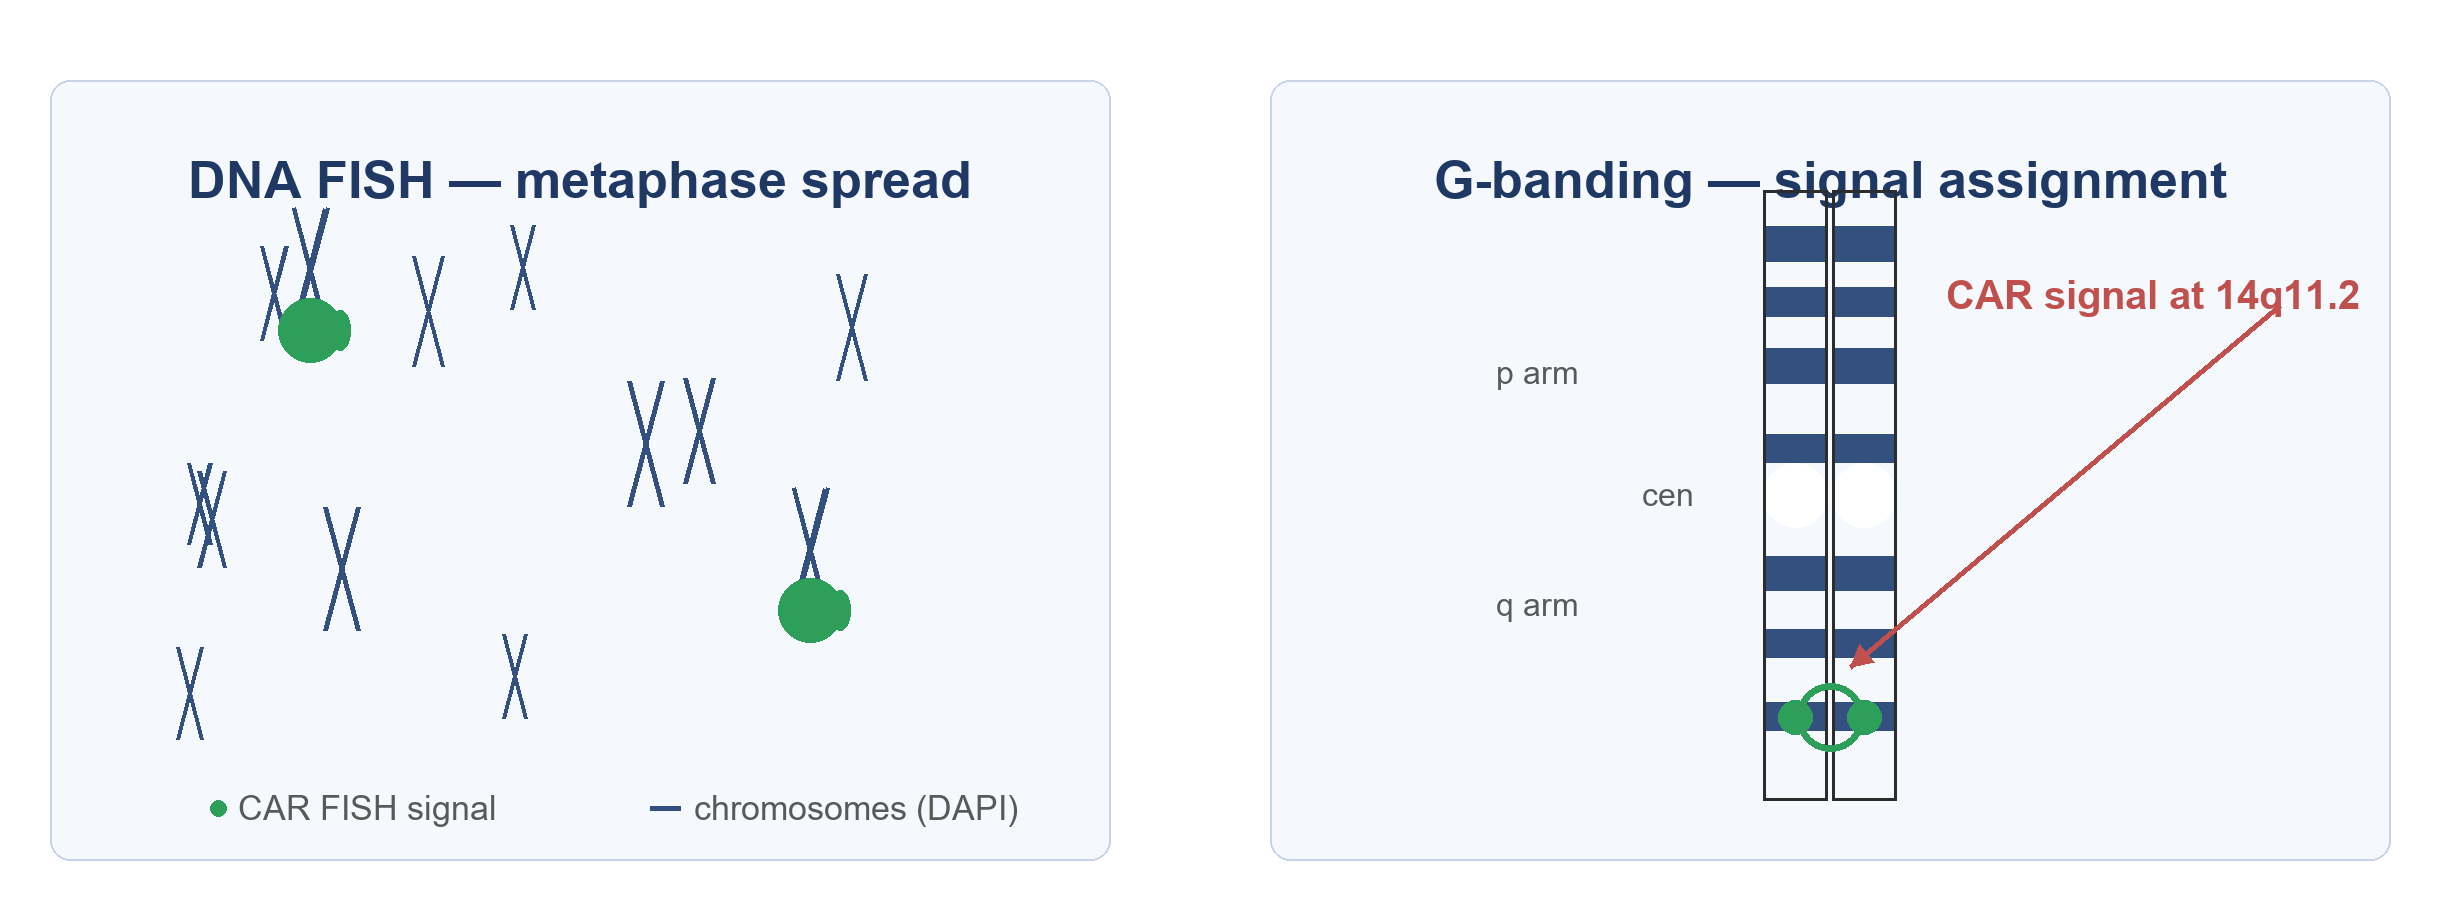 Figure 2. Detection principle: a CAR-specific probe produces a green signal on metaphase chromosomes (left); G-banding localizes the signal to a defined band, e.g. 14q11.2 (right).
A single experiment answers three questions: Where did the CAR integrate — chromosome and band, reported in ISCN nomenclature? Is integration accompanied by structural abnormality — translocation, inversion, or large deletion? And what does integration look like at the single-cell level — signal patterns and mosaicism?
Service Capabilities
- Integration site localization — assignment of CAR FISH signals to a specific chromosome and band by G-banding.
- Structural abnormality screening — detection of translocations, inversions, large deletions, and other rearrangements.
- Single-cell signal patterns — single vs. multiple signal patterns and mosaicism, assessed cell by cell.
- Sample compatibility — in vitro engineered T cells and PBMC (viable cells or fixed preparations); for studies performed in animal models, PBMC is a convenient sample — metaphases are prepared by PHA stimulation.
- Orthogonal evidence — visual, chromosome-level confirmation that complements NGS-based ISA.
How This Service Supports Early R&D
- Post-editing verification — after CRISPR-mediated knock-in at a safe harbor locus such as TRAC or AAVS1, confirm that the CAR signal localizes to the expected region and screen for large deletions.
- Platform comparison — compare delivery vectors or editing strategies for integration accuracy before animal studies.
- Clone characterization — verify integration pattern and an intact karyotype before scale-up.
- Orthogonal validation — corroborate ISA findings with chromosome-level images for early IND-enabling conversations.
Complementing, Not Replacing, Sequencing
Sequencing-based ISA maps insertion loci at base-pair resolution across pooled populations, but it resolves structural complexity poorly — large deletions and rearrangements that short reads miss. FISH and G-banding provide the "big picture": visual, single-cell, chromosome-level evidence; sequencing provides the nucleotide detail. This is the layered strategy experts recommend for regulatory-grade genomic safety assessment. Our service works alongside, never against, your sequencing program.
Service Workflow and Deliverables
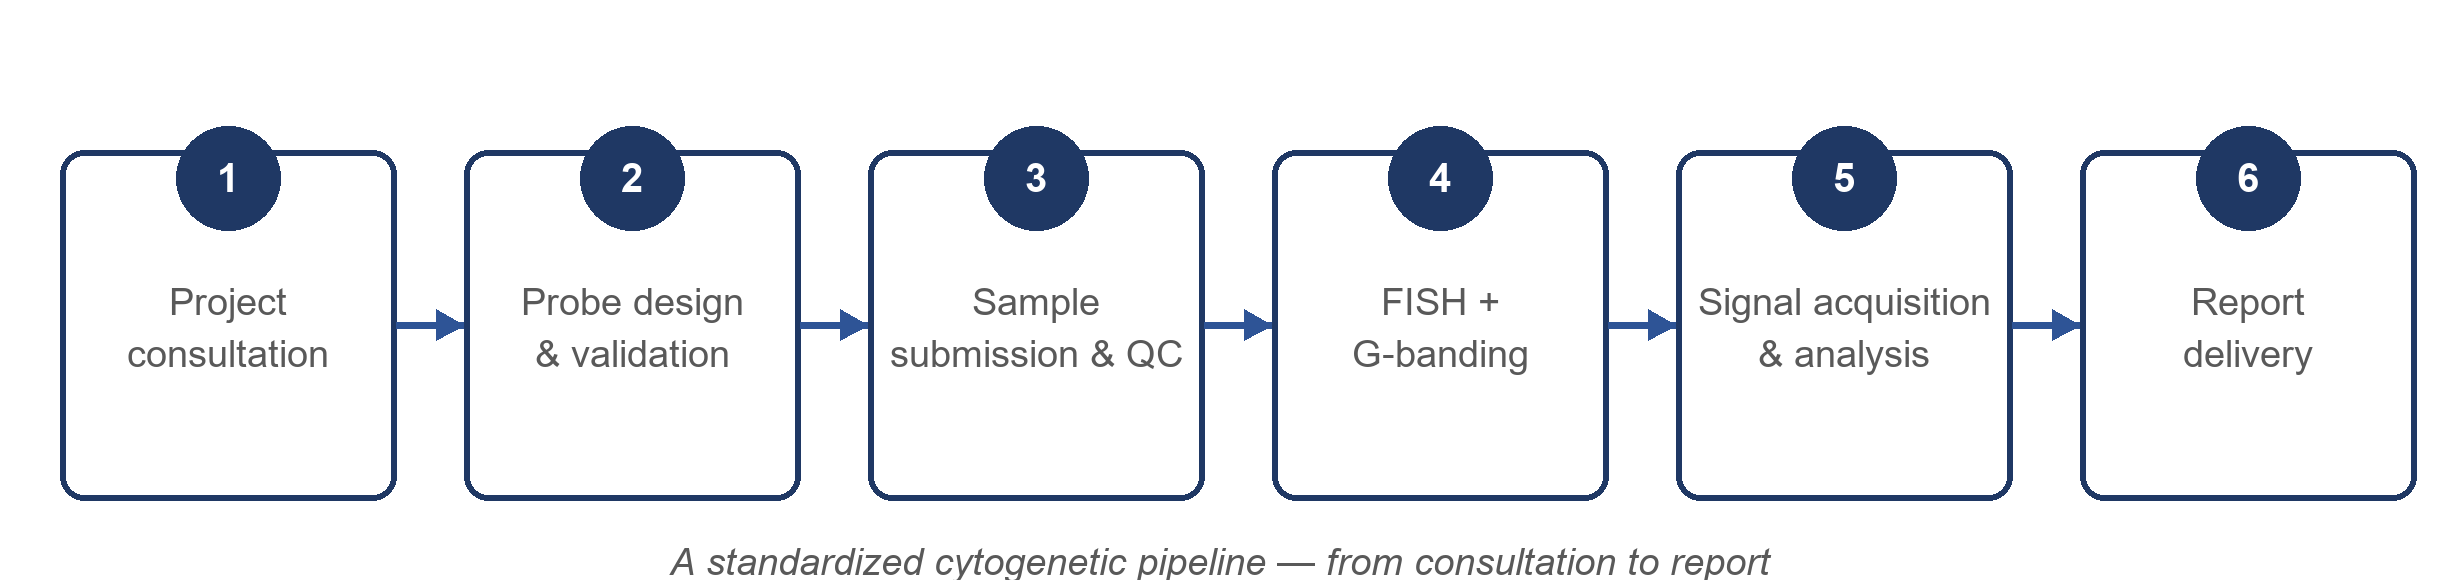 Figure 3. A standardized cytogenetic pipeline, from consultation to report.
Deliverables include raw fluorescence images, a G-banded karyotype with signal annotation, integration site mapping (ISCN), structural abnormality assessment, a quantitative summary, and a written report.
Sample Requirements
| Sample type | Recommended format | Recommended quantity | Key notes |
|---|---|---|---|
| In vitro engineered T cells | Viable cells; fixed suspensions; metaphase spreads | ≥1 × 10⁶ viable cells | Mitotic stimulation (e.g., PHA/IL-2) may be required for metaphase analysis |
| PBMC (e.g., from animal model studies) | Viable cells | ≥1 × 10⁶ viable cells | A convenient option when experiments are performed in mice; metaphase chromosomes are prepared by PHA stimulation |
Requirements can be tailored to your study design — please contact Creative Bioarray to confirm the best sample format.
Frequently Asked Questions
Q: How is this different from sequencing-based integration site analysis?
A: Sequencing maps the nucleotide position of integration across a pooled population; FISH and G-banding show the physical location of the transgene on individual chromosomes and screen the karyotype for structural abnormalities. The two are complementary and best used together.
Q: Can you tell whether the integration is at a "safe harbor" locus?
A: Yes — we localize the signal to a specific chromosome and band; if it corresponds to a known safe harbor such as TRAC (14q11.2) or AAVS1 (19q13.42), the report will state that. For exact junction confirmation, sequencing remains the appropriate tool.
Q: Is this service for clinical use?
A: No. This service is strictly for research and early development purposes and is not intended for clinical diagnostic use.
Scientific Context and References
Our approach builds on established precedent: FISH was applied to evaluate CAR integration patterns in Sleeping Beauty-engineered T cells (Maiti et al., 2013); safe-harbor integration is reviewed as a strategy against secondary malignancies (Safarzadeh Kozani et al., 2025); dGH-FISH has revealed megabase-scale deletions at CRISPR editing sites; and regulators expect integration site analysis, vector characterization, and up to 15 years of long-term follow-up for integrating vector products (Pažėraitis & Kupčinskas, 2026).
References
- Maiti S, et al. Sleeping Beauty system to redirect T-cell specificity for human applications. Journal of Immunotherapy, 2013.
- Safarzadeh Kozani P, et al. Preventing secondary primary malignancies in CAR-T cell therapy through site-specific transgene integration into genomic safe harbors. Journal of Translational Medicine, 2025.
- Pažėraitis D, Kupčinskas J. Integration site analysis in engineered T cell therapies: what we measure, what we miss, and what regulators expect. Cell & Gene Therapy Insights, 2026; 12(1): 135–150.
- U.S. Food and Drug Administration. Boxed Warning for CD19- and BCMA-directed CAR-T cell products regarding risk of secondary T-cell malignancies, April 2024.
Contact Us
If you are developing an in vivo CAR-T vector, evaluating site-specific integration strategies, or generating genomic safety evidence for an early-stage program, we would be glad to discuss how FISH and G-banded analysis can support your research.
Explore Other Options